Fig. D.5
Download original image
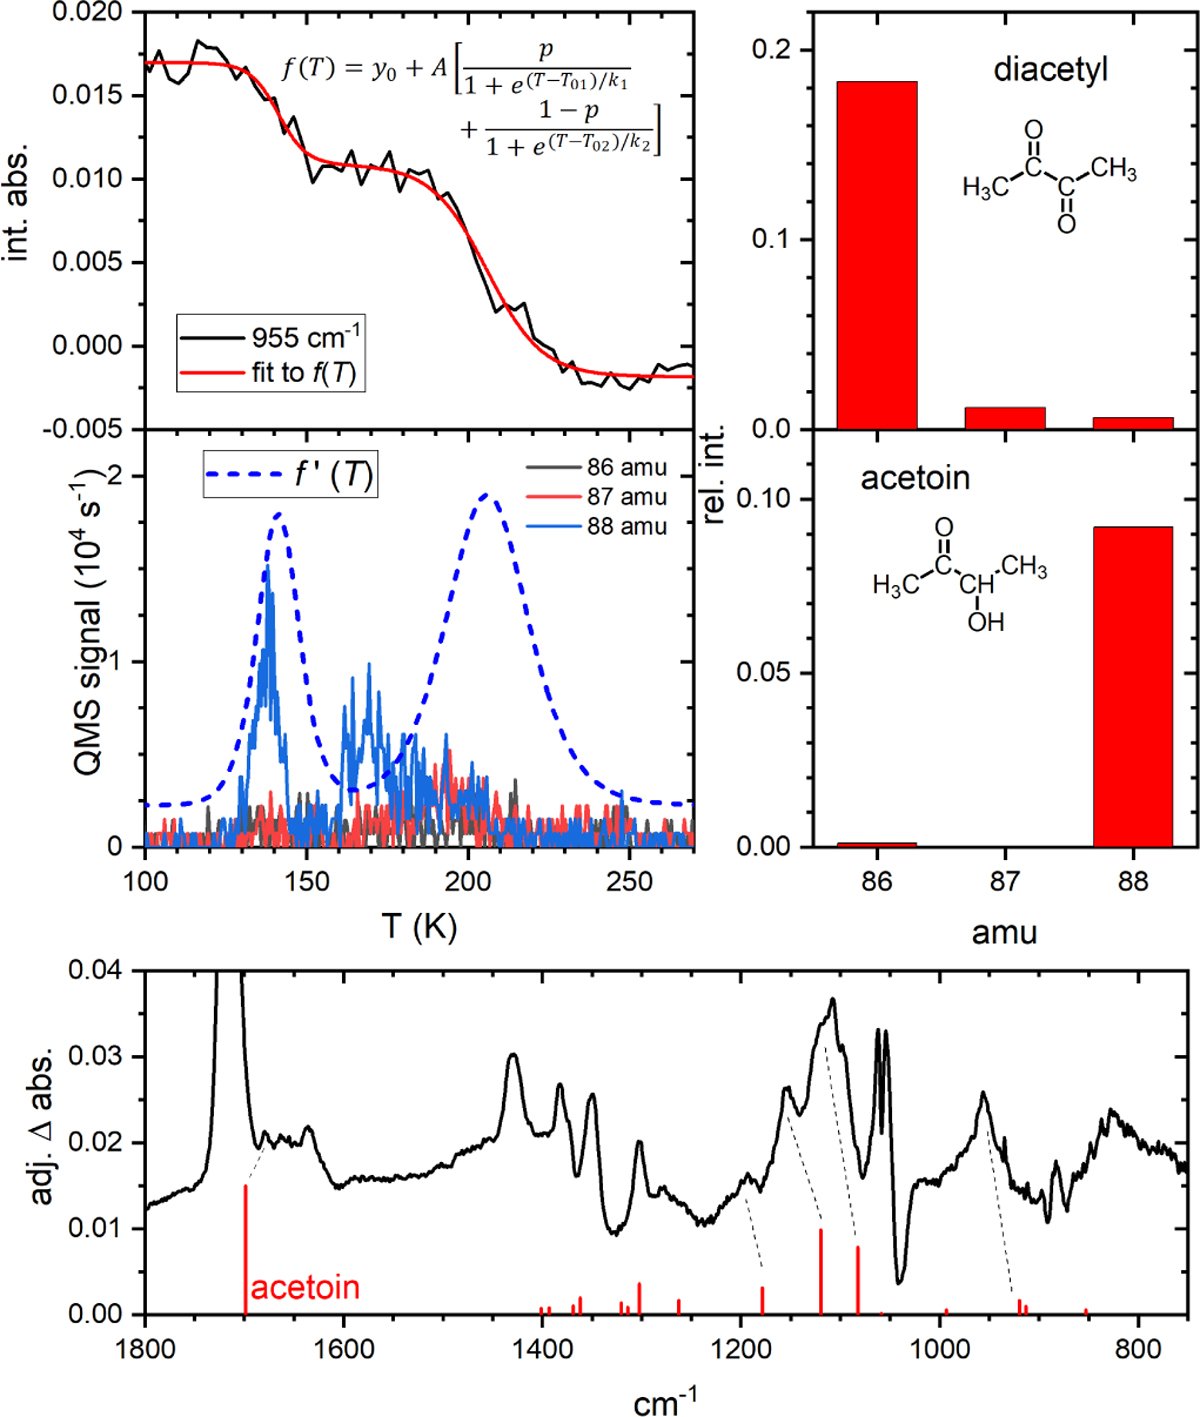
(top-left) Average TPD curve for the ca. 955 cm−1 feature. These data are fit to the functional form indicated in the inset. (middle-left) Derivative of this fit function compared to the m/z = 86–88 amu mass channels for experiment F. (top- and middle-right) Fragmentation patterns for diacetyl and acetoin, obtained from the NIST database. (bottom) Final adjusted difference spectrum shown in Figure 3 compared to the calculated infrared absorption spectrum of acetoin obtained at the CAM-B3LYP/def2-tZVP level of theory. Harmonic frequencies are scaled by a factor of 0.93.
Current usage metrics show cumulative count of Article Views (full-text article views including HTML views, PDF and ePub downloads, according to the available data) and Abstracts Views on Vision4Press platform.
Data correspond to usage on the plateform after 2015. The current usage metrics is available 48-96 hours after online publication and is updated daily on week days.
Initial download of the metrics may take a while.