Fig. 4
Download original image
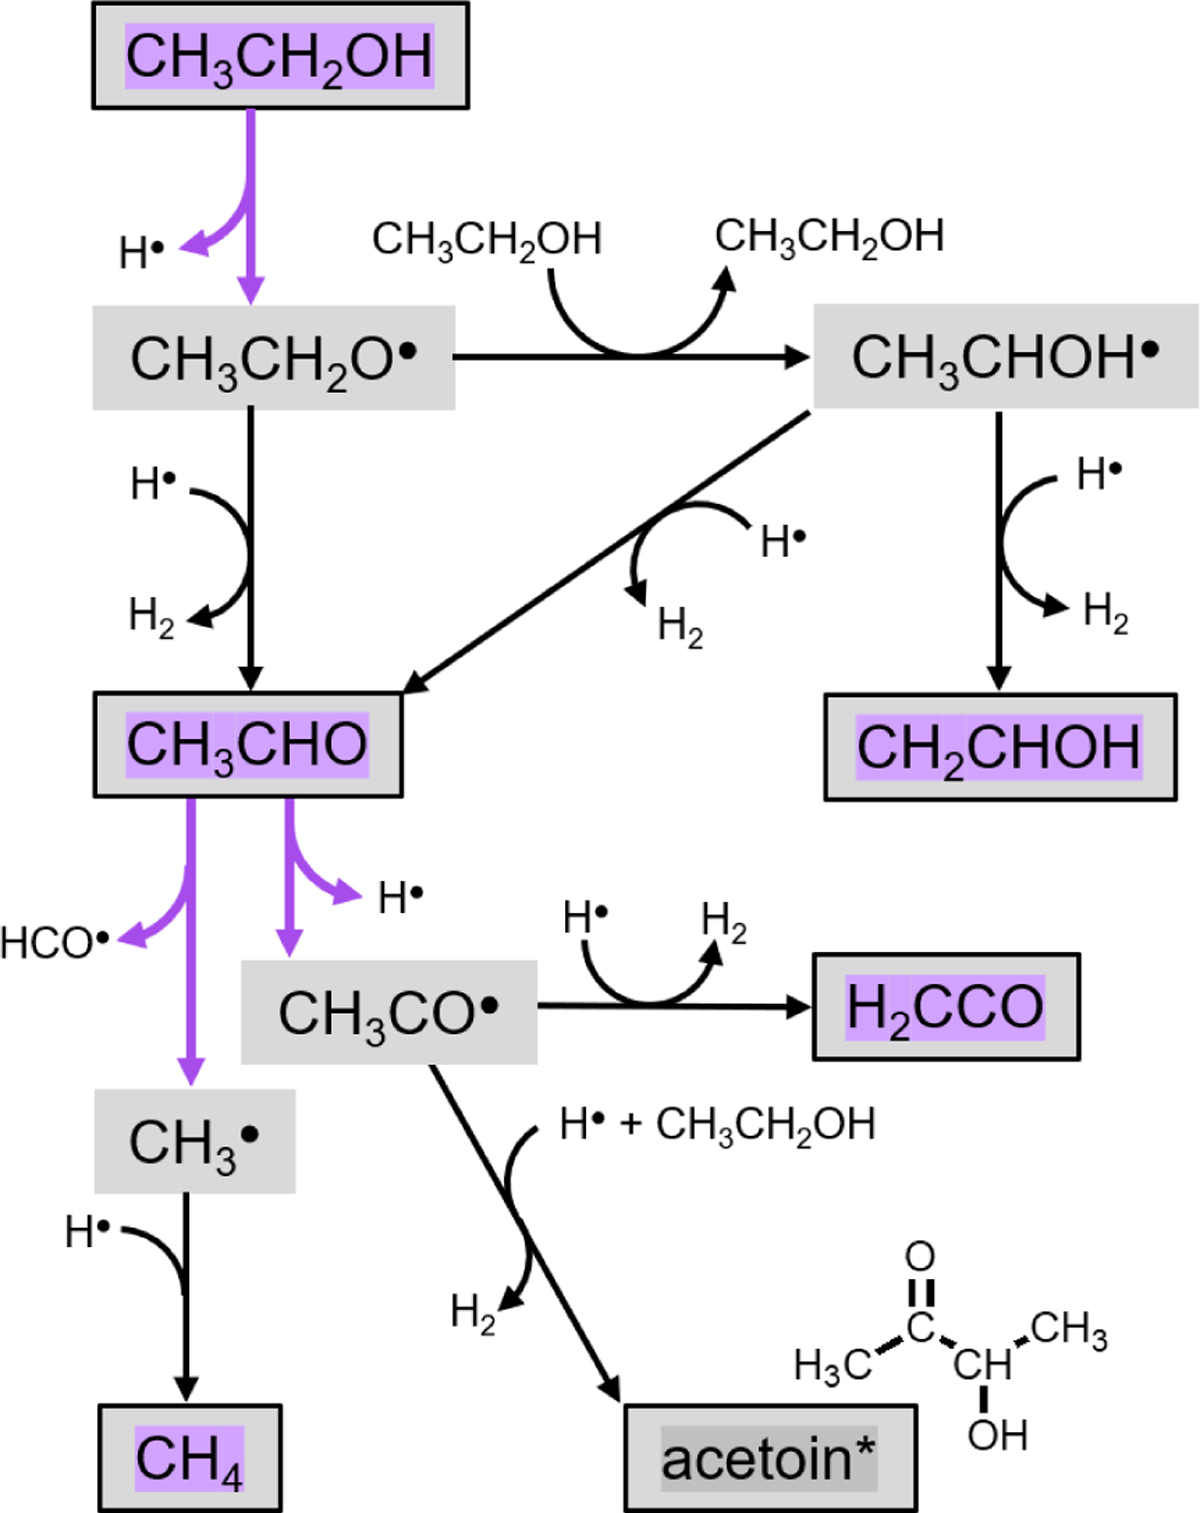
Partial reaction diagram reflecting processes in the pure ethanol photolysis experiments. Purple arrows indicate processes induced by photon absorption. Highlighted species have been identified in the RAIR spectra; those with boxes around them are considered to be “stable,” i.e., do not react further unless exposed to another reactive species. Acetoin is highlighted in gray due to the tentative nature of this assignment.
Current usage metrics show cumulative count of Article Views (full-text article views including HTML views, PDF and ePub downloads, according to the available data) and Abstracts Views on Vision4Press platform.
Data correspond to usage on the plateform after 2015. The current usage metrics is available 48-96 hours after online publication and is updated daily on week days.
Initial download of the metrics may take a while.