Fig. 7
Download original image
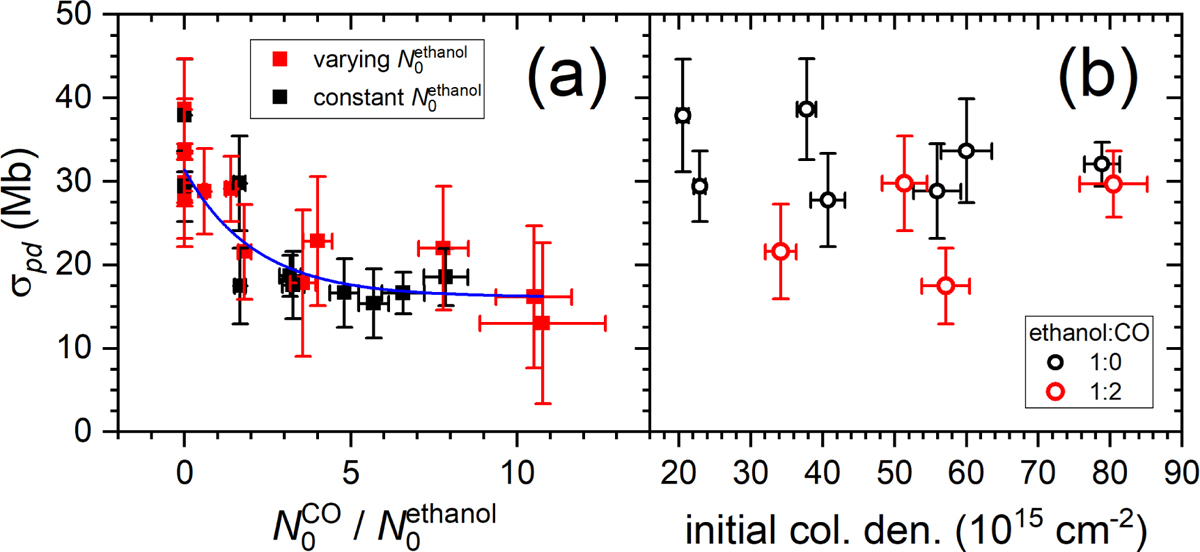
Photodestruction cross sections of ethanol in pure and mixed ice samples (1 Mb = 10−18 cm2). (a) Results are plotted versus the mixing ratio with CO. The black data markers correspond to Series 1, wherein the initial column density of ethanol is fixed at around 2 × 1016 cm−2, and the mixing ratio and total initial thickness vary. The blue line shows the fit summarized in Eq. (31). (b) Results are plotted for data series where the fractional composition of the initial ice mixture is held constant and the total thickness is varied.
Current usage metrics show cumulative count of Article Views (full-text article views including HTML views, PDF and ePub downloads, according to the available data) and Abstracts Views on Vision4Press platform.
Data correspond to usage on the plateform after 2015. The current usage metrics is available 48-96 hours after online publication and is updated daily on week days.
Initial download of the metrics may take a while.