Fig. A.1
Download original image
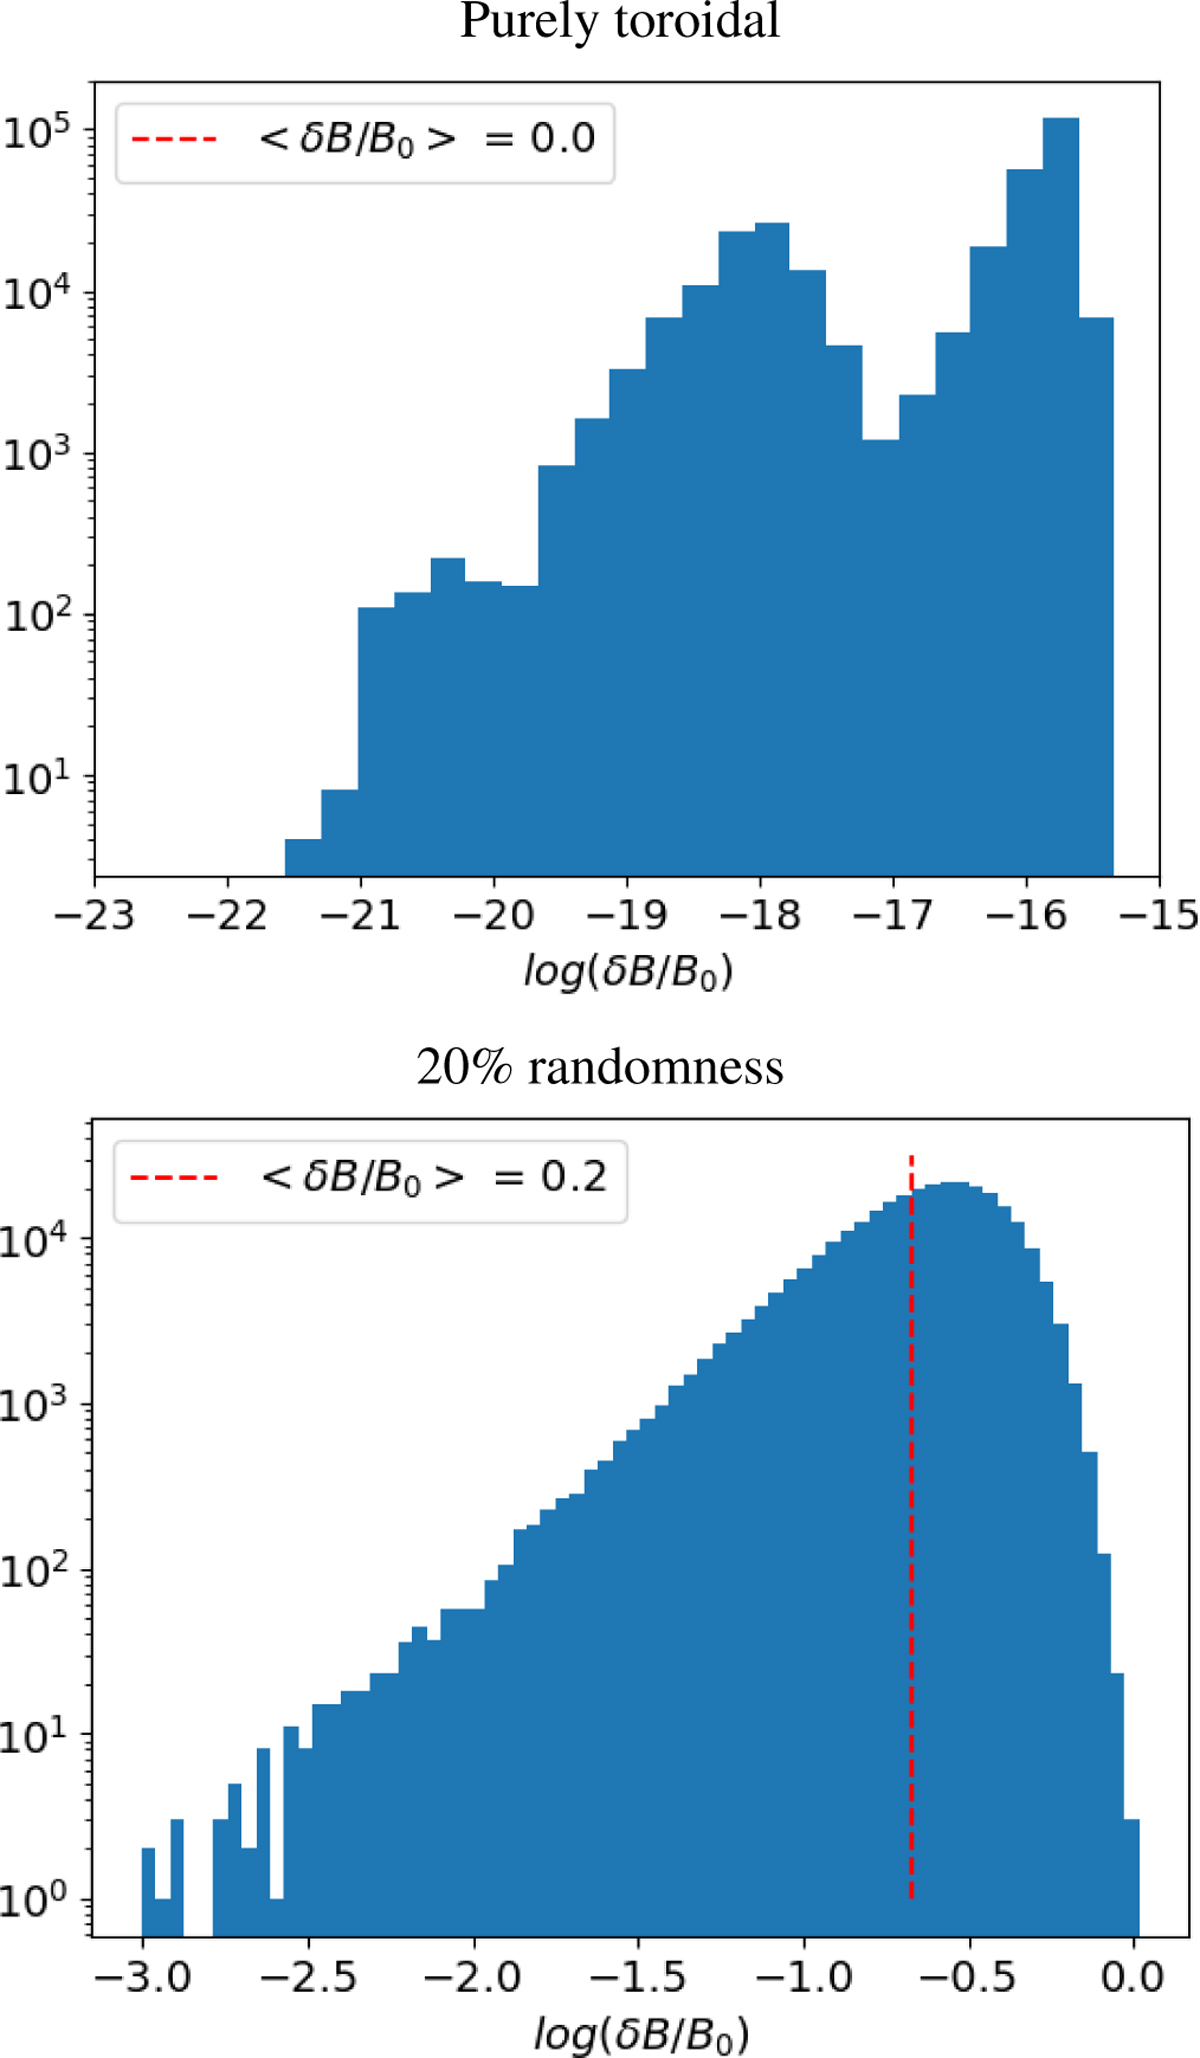
Histograms of log(δB/B0) for a purely toroidal field (left) and for a field with 20% perturbations added (right). The dashed red line indicates the mean value of δB/B0. In the toroidal case, values remain close to machine precision, confirming δB ≈ 0; whereas with a 20% perturbations the mean shifts to ≃ 0.2, as expected from the imposed randomness.
Current usage metrics show cumulative count of Article Views (full-text article views including HTML views, PDF and ePub downloads, according to the available data) and Abstracts Views on Vision4Press platform.
Data correspond to usage on the plateform after 2015. The current usage metrics is available 48-96 hours after online publication and is updated daily on week days.
Initial download of the metrics may take a while.