Fig. 1.
Download original image
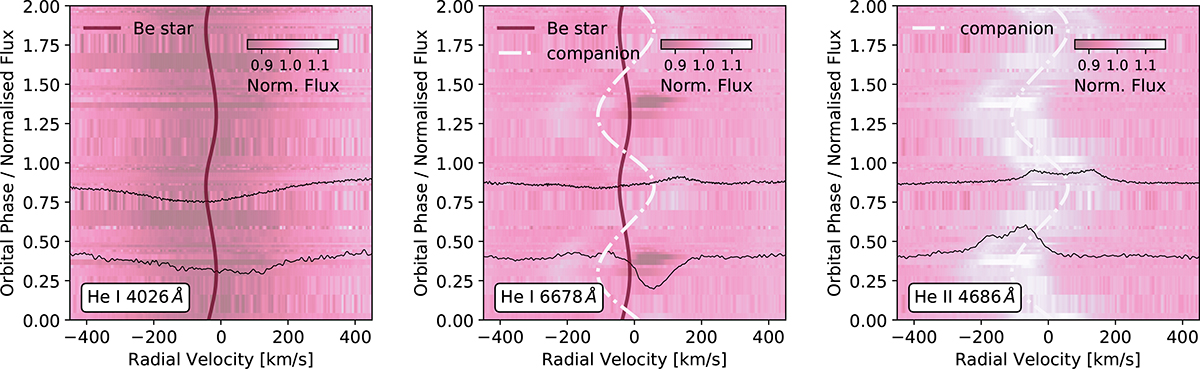
Dynamical spectra of MWC 656 shown over two orbital cycles. From left to right, the panels display the HeI [[INLINE31]], HeI [[INLINE32]], and HeII [[INLINE33]] lines. Two epoch spectra near quadrature phases are overplotted in black to further illustrate line profile variations. The orbital RV curves of the Be star (pink) and the companion (white), derived from the best-fit orbit model, are overlaid and trace the associated absorption and emission features.
Current usage metrics show cumulative count of Article Views (full-text article views including HTML views, PDF and ePub downloads, according to the available data) and Abstracts Views on Vision4Press platform.
Data correspond to usage on the plateform after 2015. The current usage metrics is available 48-96 hours after online publication and is updated daily on week days.
Initial download of the metrics may take a while.