Fig. 5
Download original image
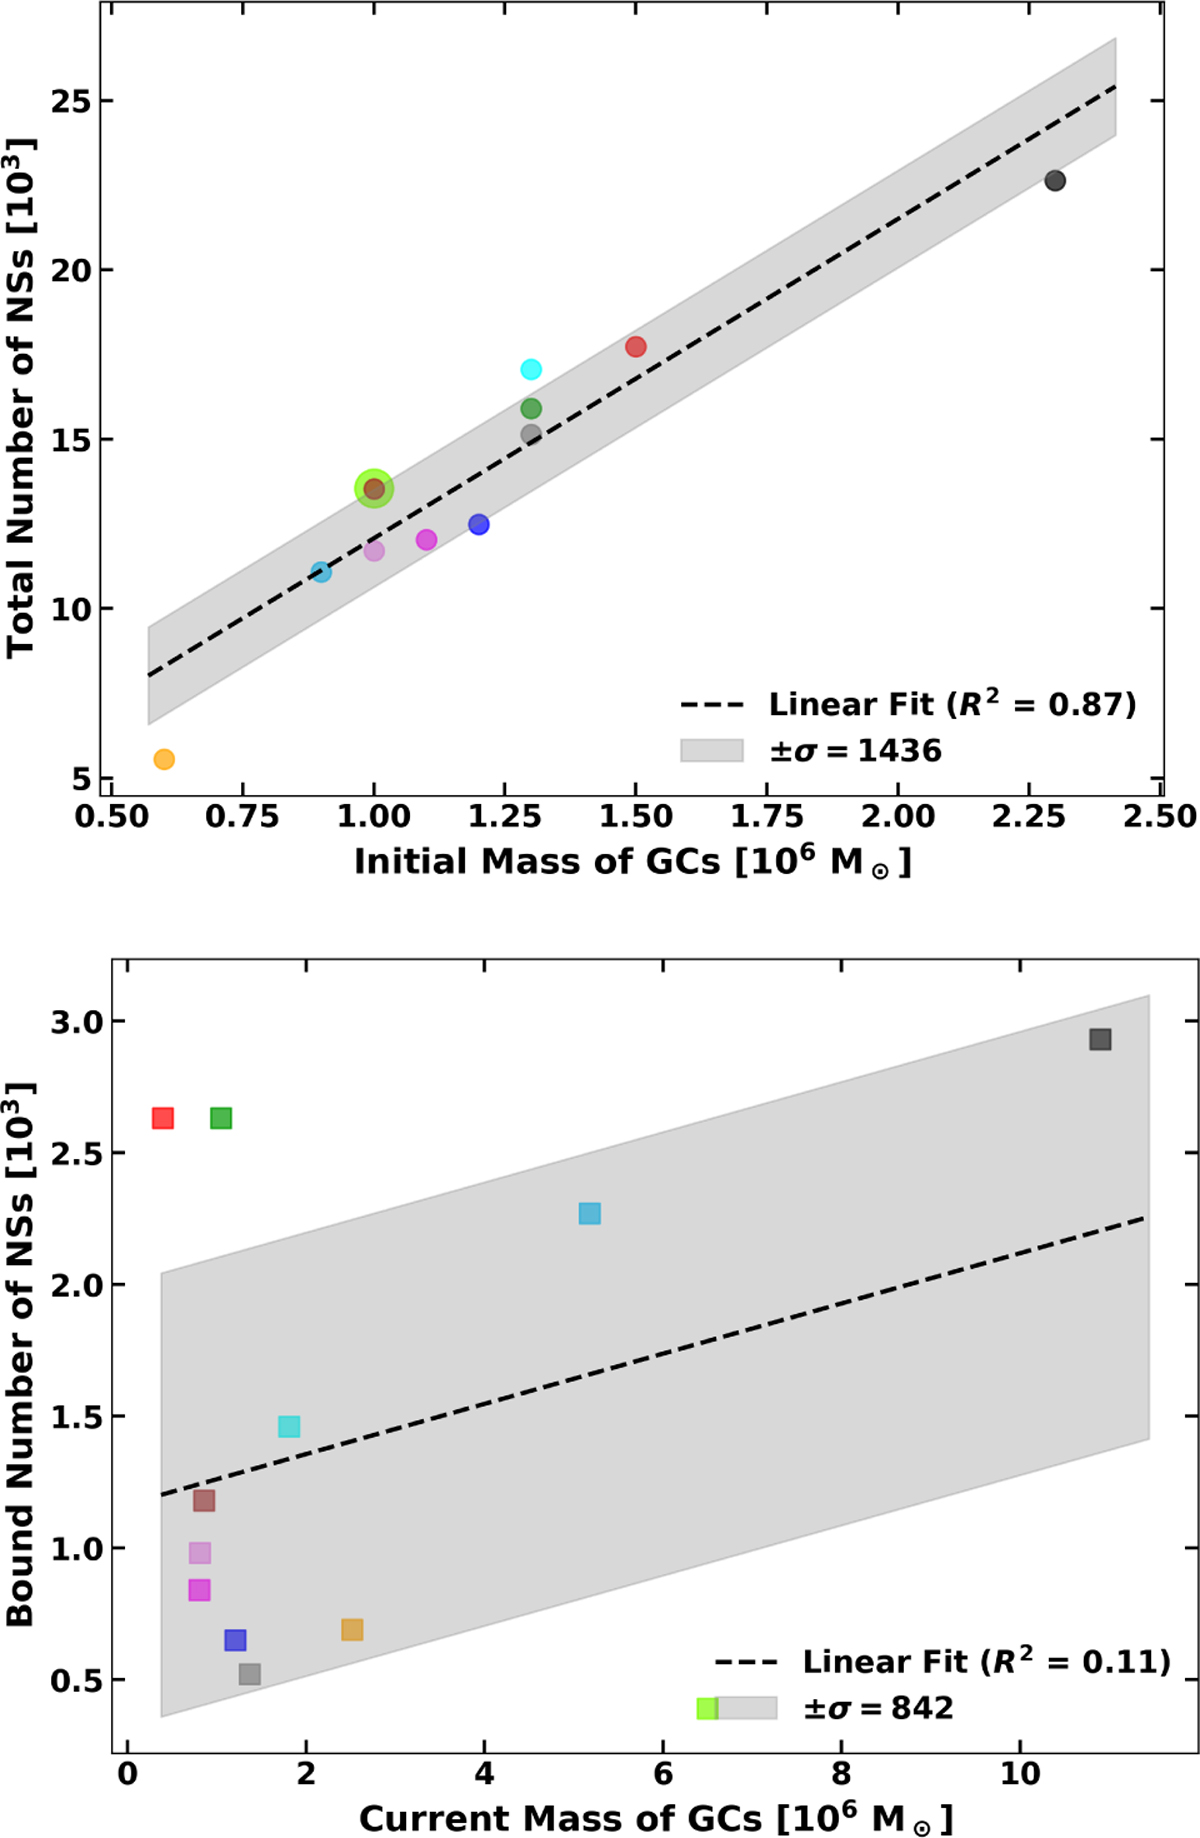
Relationship between GC mass and NS populations. Colours denote individual clusters as listed in legend of Fig. 2. The full dataset is given in Table 2. Top: initial mass of GCs vs the total number of NSs formed up to the present day. The dashed line shows the best-fit linear relation (slope = 9428.42 NSs per 106M⊙, R2 = 0.87), with the shaded region representing the ±1436 NSs scatter around the fit. Bottom: current mass of GCs vs bound number of NSs. The dashed line shows the best-fit linear relation (slope = 95.29 NSs per 105 M⊙, R2 = 0.11), with the shaded region representing the ±842 NSs scatter around the fit.
Current usage metrics show cumulative count of Article Views (full-text article views including HTML views, PDF and ePub downloads, according to the available data) and Abstracts Views on Vision4Press platform.
Data correspond to usage on the plateform after 2015. The current usage metrics is available 48-96 hours after online publication and is updated daily on week days.
Initial download of the metrics may take a while.