Fig. 6
Download original image
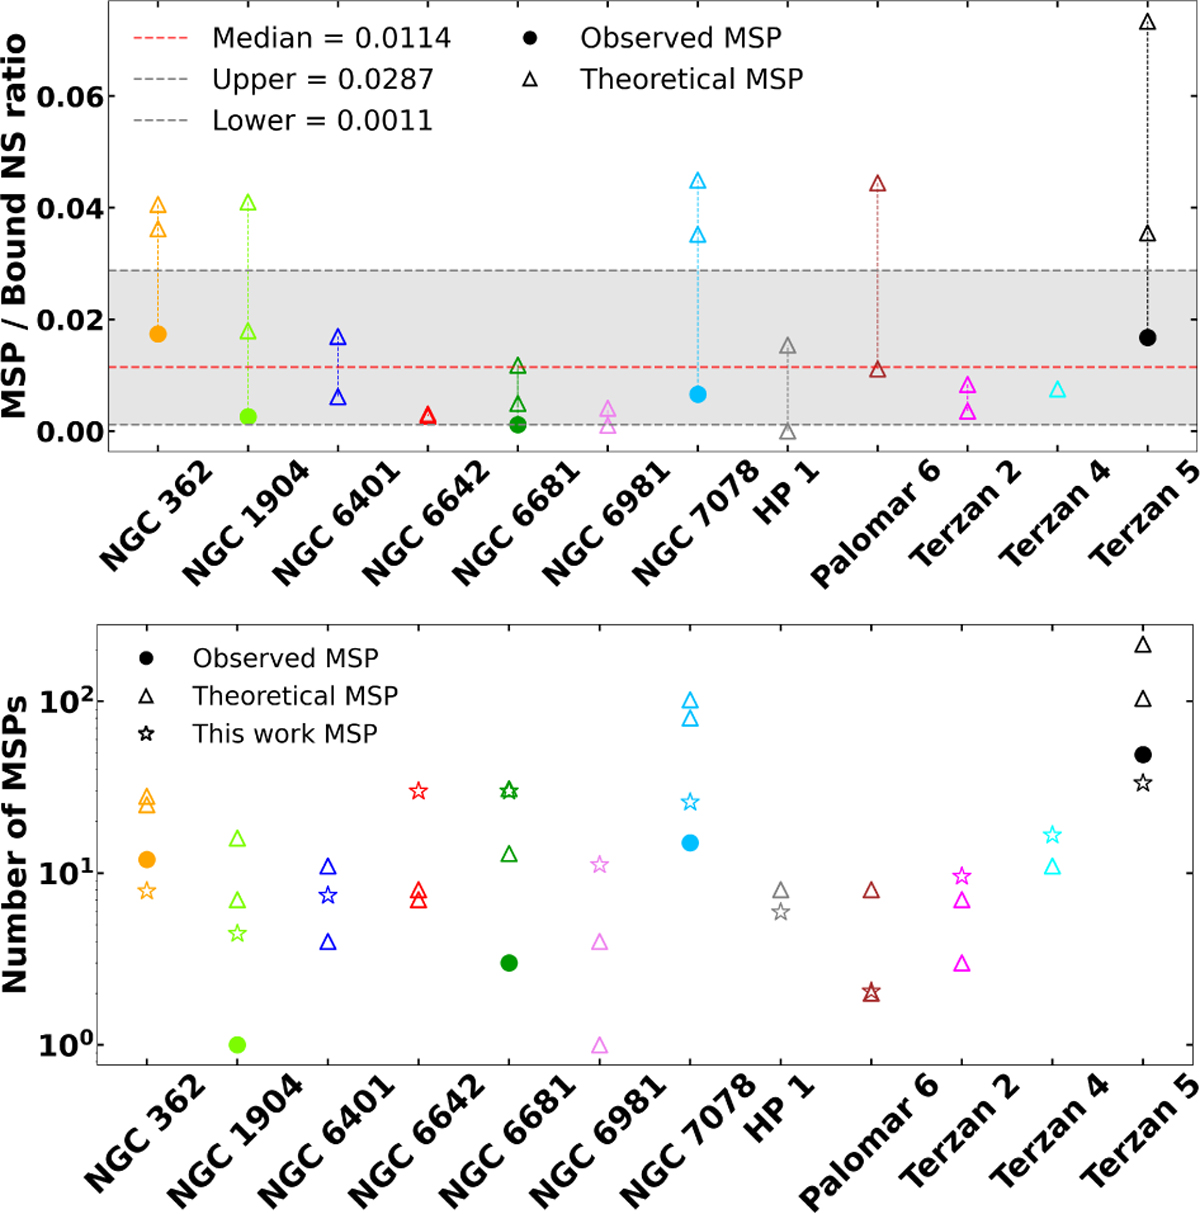
MSP populations in selected GCs. Top: MSP-to-bound NS ratio. Colours correspond to individual clusters as shown in the legend of Fig. 2, and colour dashed lines connect multiple estimates for the same cluster. Filled circles represent observed MSPs and open triangles show theoretical predictions. The red dashed line indicates the median value, while the shaded region represents the median absolute deviation (MAD) range. Lower panel: number of MSPs in the selected GCs. Star symbols denote MSP numbers predicted in this work, computed as NMSP = 0.0114 × NBound NS based on our simulation results.
Current usage metrics show cumulative count of Article Views (full-text article views including HTML views, PDF and ePub downloads, according to the available data) and Abstracts Views on Vision4Press platform.
Data correspond to usage on the plateform after 2015. The current usage metrics is available 48-96 hours after online publication and is updated daily on week days.
Initial download of the metrics may take a while.