Fig. 7
Download original image
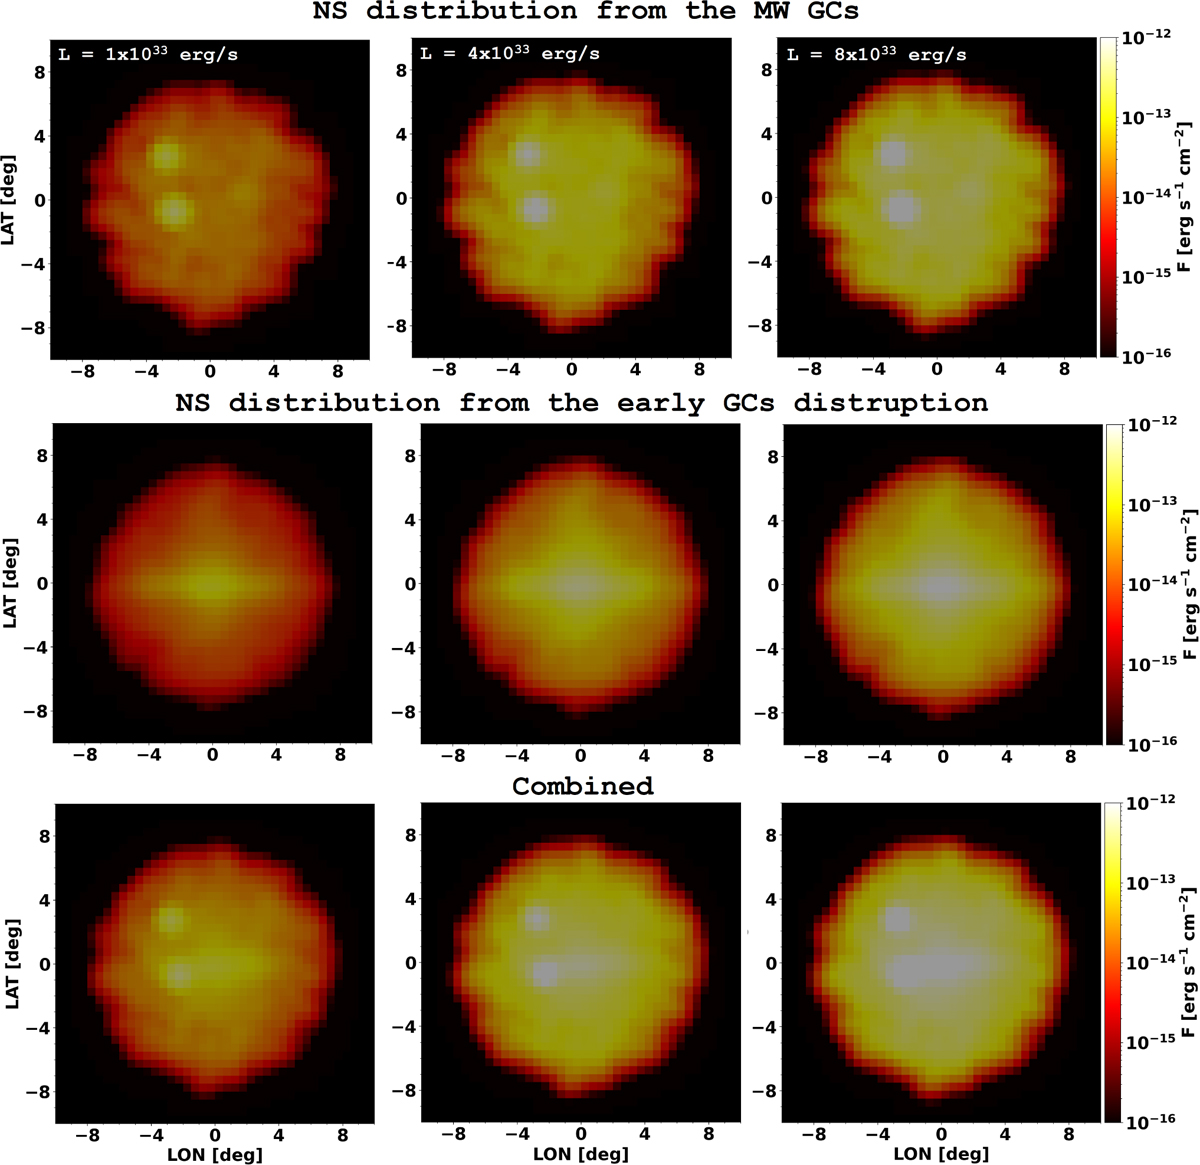
γ-ray flux maps from simulated NSs within 1 kpc in Galactic coordinates. The flux is computed assuming a MSP luminosity of ⟨L⟩ ∼ 1 × 1033 erg/s (left), ⟨L⟩ ∼ 4 × 1033 erg/s (middle), and ⟨L⟩ ∼ 8 × 1033 erg/s (right), scaled by empirical factors for observed GCs (top), disrupted GCs (middle), and the combination of both populations (bottom). The colour scale indicates the total γ-ray flux in each bin, shown on a logarithmic scale between 10−12 and 10−16 erg s−1 cm−2. To obtain a smoother flux map, we applied a Gaussian filter with a smoothing parameter of σ = 1, which corresponds to a smoothing scale of approximately 0.5°.
Current usage metrics show cumulative count of Article Views (full-text article views including HTML views, PDF and ePub downloads, according to the available data) and Abstracts Views on Vision4Press platform.
Data correspond to usage on the plateform after 2015. The current usage metrics is available 48-96 hours after online publication and is updated daily on week days.
Initial download of the metrics may take a while.