Fig. 8
Download original image
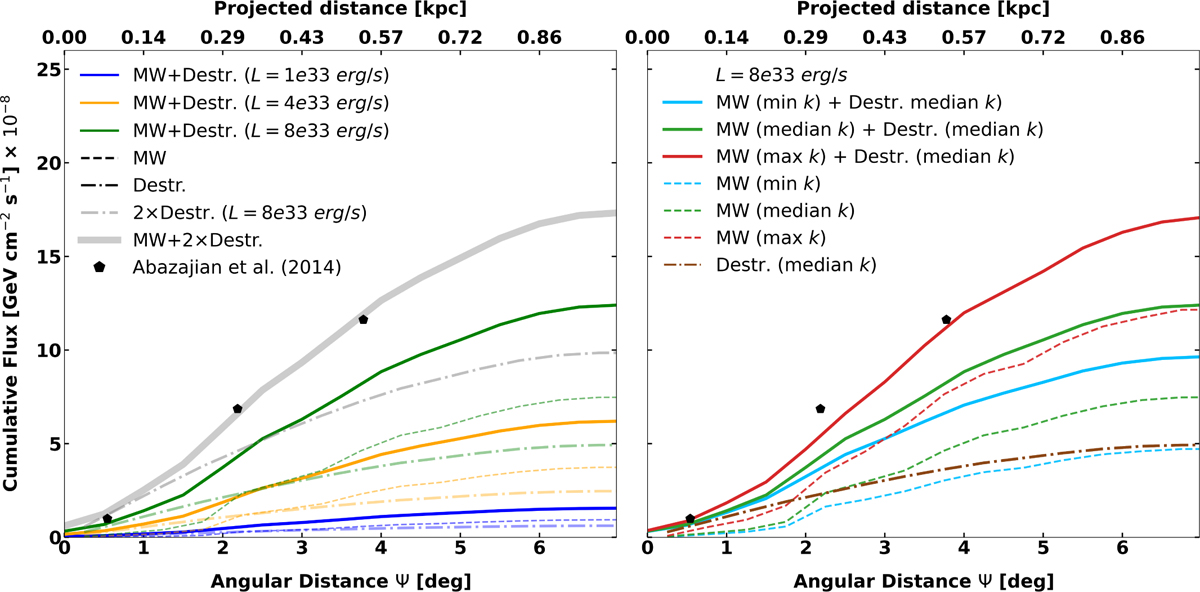
Cumulative γ-ray flux as a function of projected radius from the GalC. The bottom axis shows the angular distance Ψ in degrees, while the top axis indicates the corresponding projected distance in kiloparsecs, assuming a Sun–GalC distance of 8178 pc. Left panel: results for three different luminosities: L = 1 × 1033 erg s−1 (blue), L = 4 × 1033 erg s−1 (orange), and L = 8 × 1033 erg s−1 (green). Right: case with fixed luminosity of L = 8 × 1033 erg s−1, but different values of the scaling parameter k: the median value k = 0.0114 (same green as on the left), the maximum individual value, corresponding to theor2 from Yin et al. (2024, shown in red), and the minimum individual value, corresponding to theor1 from Turk & Lorimer (2013, shown in sky blue,) as listed in Table 3 for each cluster. The legends in the figure: MW is the cumulative flux calculated only based on the selected real MW clusters (see Table 1); Destr. refers to fluxes calculated only on the basis of the theoretical, already destroyed clusters; MW+Destr. is the sum of the flux from real MW plus the Destr. theoretical clusters; MW + 2 × Destr. is the same as the above sum, but with the contribution from the ‘Destr.’ clusters artificially enhanced by a factor of 2.
Current usage metrics show cumulative count of Article Views (full-text article views including HTML views, PDF and ePub downloads, according to the available data) and Abstracts Views on Vision4Press platform.
Data correspond to usage on the plateform after 2015. The current usage metrics is available 48-96 hours after online publication and is updated daily on week days.
Initial download of the metrics may take a while.