Fig. 4.
Download original image
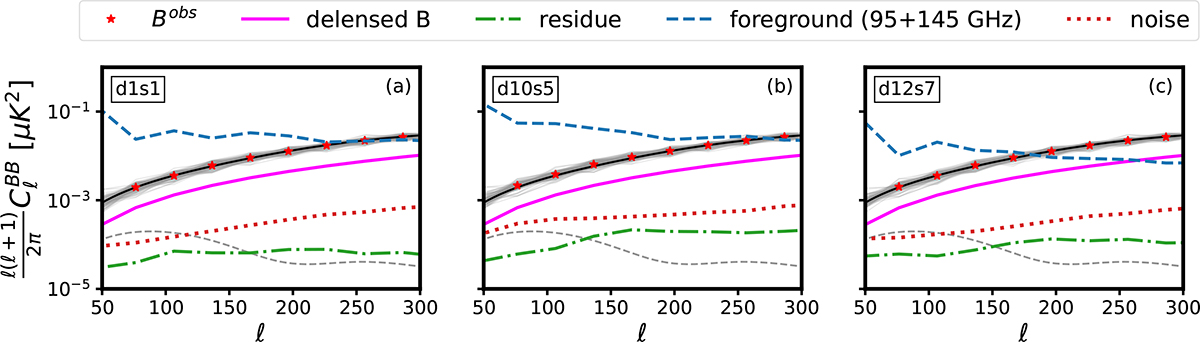
Angular power spectra for CMB B-mode-cleaned maps for the SAT configuration and sky coverage. The solid grey zigzag lines are BB power spectra of 100 simulations, and the average is shown as red stars. The theoretical input power spectra are shown as solid black lines. The residual HILC noise and foreground levels are shown as dotted and dashed lines, respectively. The solid magenta line shows the average de-lensed B-mode spectra over 100 simulations. The dashed blue line shows the average power spectra of Galactic-foreground B modes at the frequency channels 95 and 145 GHz. The dashed grey line shows the tensor B-mode level for r = 0.003.
Current usage metrics show cumulative count of Article Views (full-text article views including HTML views, PDF and ePub downloads, according to the available data) and Abstracts Views on Vision4Press platform.
Data correspond to usage on the plateform after 2015. The current usage metrics is available 48-96 hours after online publication and is updated daily on week days.
Initial download of the metrics may take a while.