Fig. 5.
Download original image
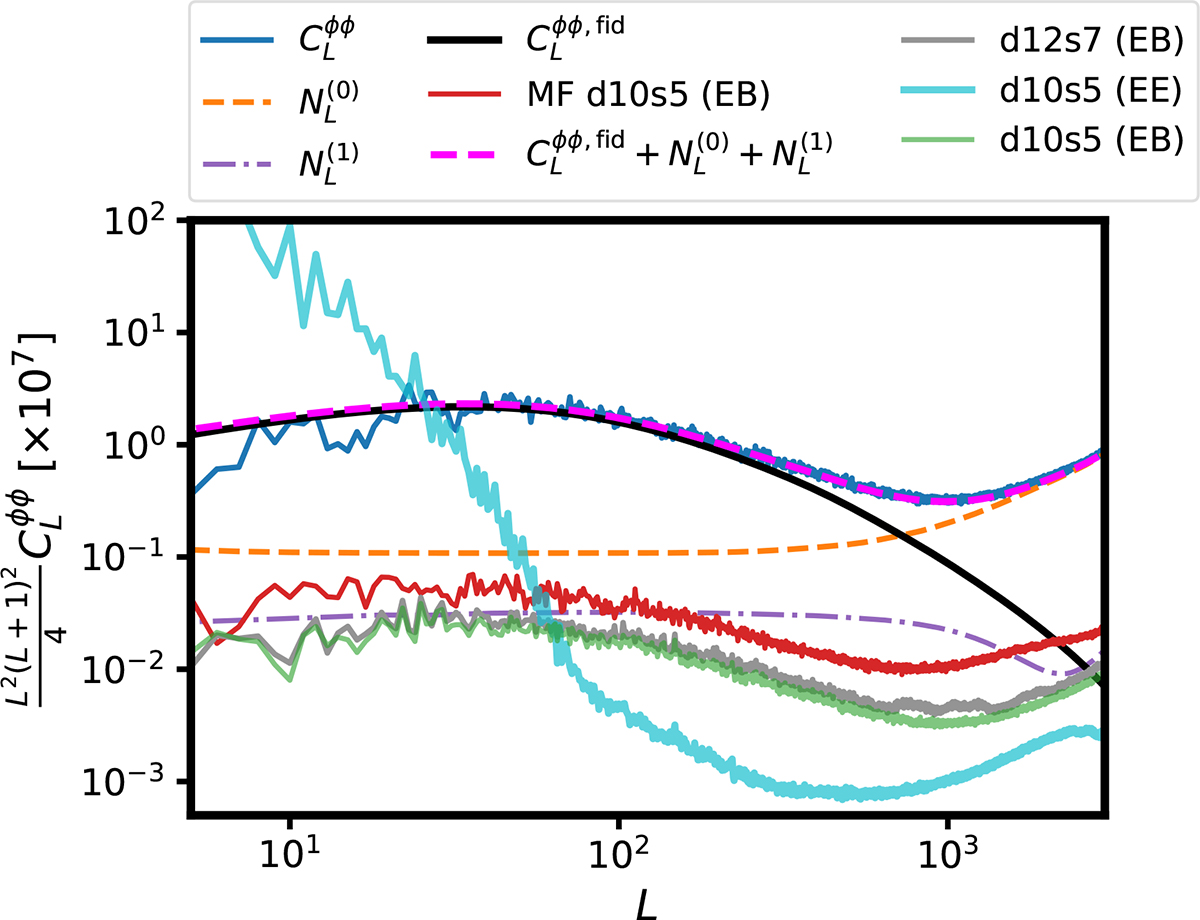
Angular power spectra of reconstructed lensing field shown as a solid blue line. The mean field effect on the EB estimator for MF maps for d10s5 and HILC-cleaned maps for d10s5 and d12s7 are shown as solid red, green, and grey lines, respectively. The mean-field effect on the EE estimator for HILC-cleaned maps of d10s5 is shown as a solid cyan line. Theoretical lensing power spectra are shown as solid black lines. The dashed magenta line is the sum of theory power spectra and lensing reconstruction noise terms, N(0) and N(1), shown as dashed (orange) and dash-dotted (purple) lines, respectively.
Current usage metrics show cumulative count of Article Views (full-text article views including HTML views, PDF and ePub downloads, according to the available data) and Abstracts Views on Vision4Press platform.
Data correspond to usage on the plateform after 2015. The current usage metrics is available 48-96 hours after online publication and is updated daily on week days.
Initial download of the metrics may take a while.