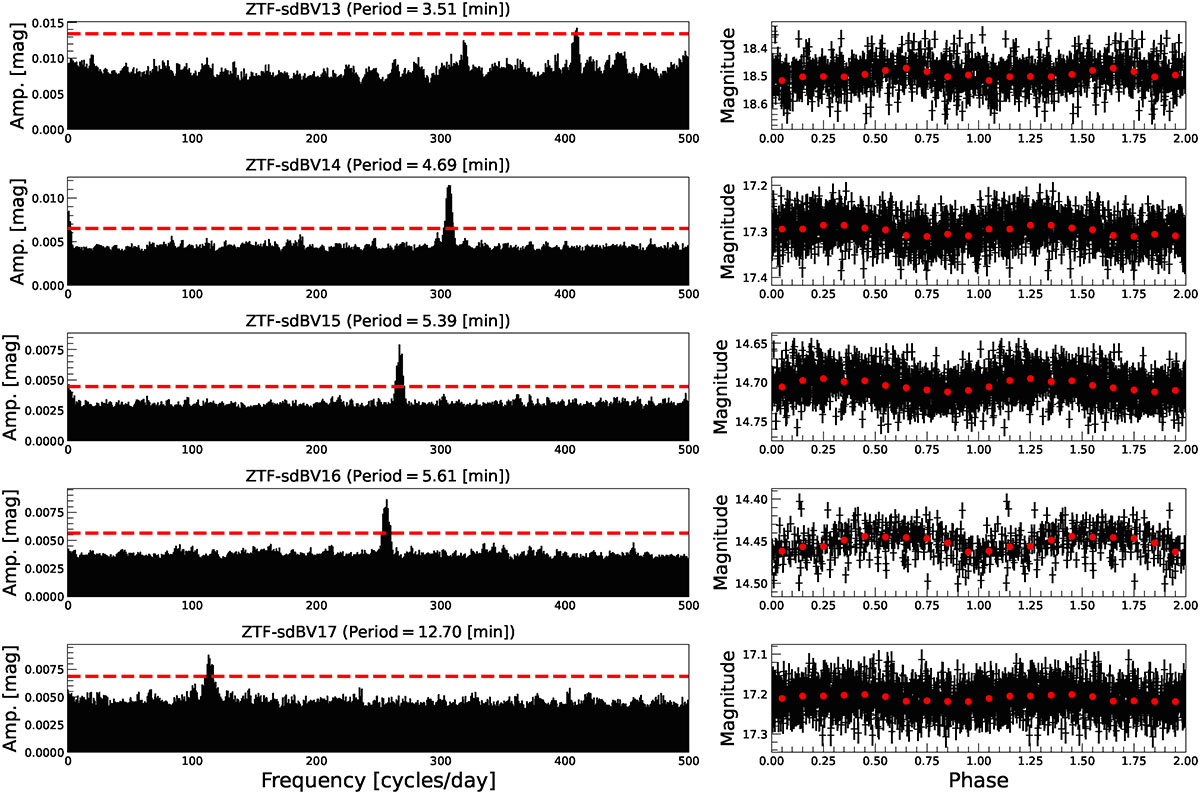
Fig. A.2.
Download original image
Zwicky Transient Facility photometry for the five new ZTF-sdBVs. Left panel: Frequency spectra of the combined g and r band data after removing any aliases found in the spectral window function, where the dashed red line represents the 5σ detection level. Right panel: Light curves in the r band (black) phase-folded on the respective frequency, overlaid with binned values (red) and plotted over two pulsation cycles for visualization.
Current usage metrics show cumulative count of Article Views (full-text article views including HTML views, PDF and ePub downloads, according to the available data) and Abstracts Views on Vision4Press platform.
Data correspond to usage on the plateform after 2015. The current usage metrics is available 48-96 hours after online publication and is updated daily on week days.
Initial download of the metrics may take a while.