Fig. C.1.
Download original image
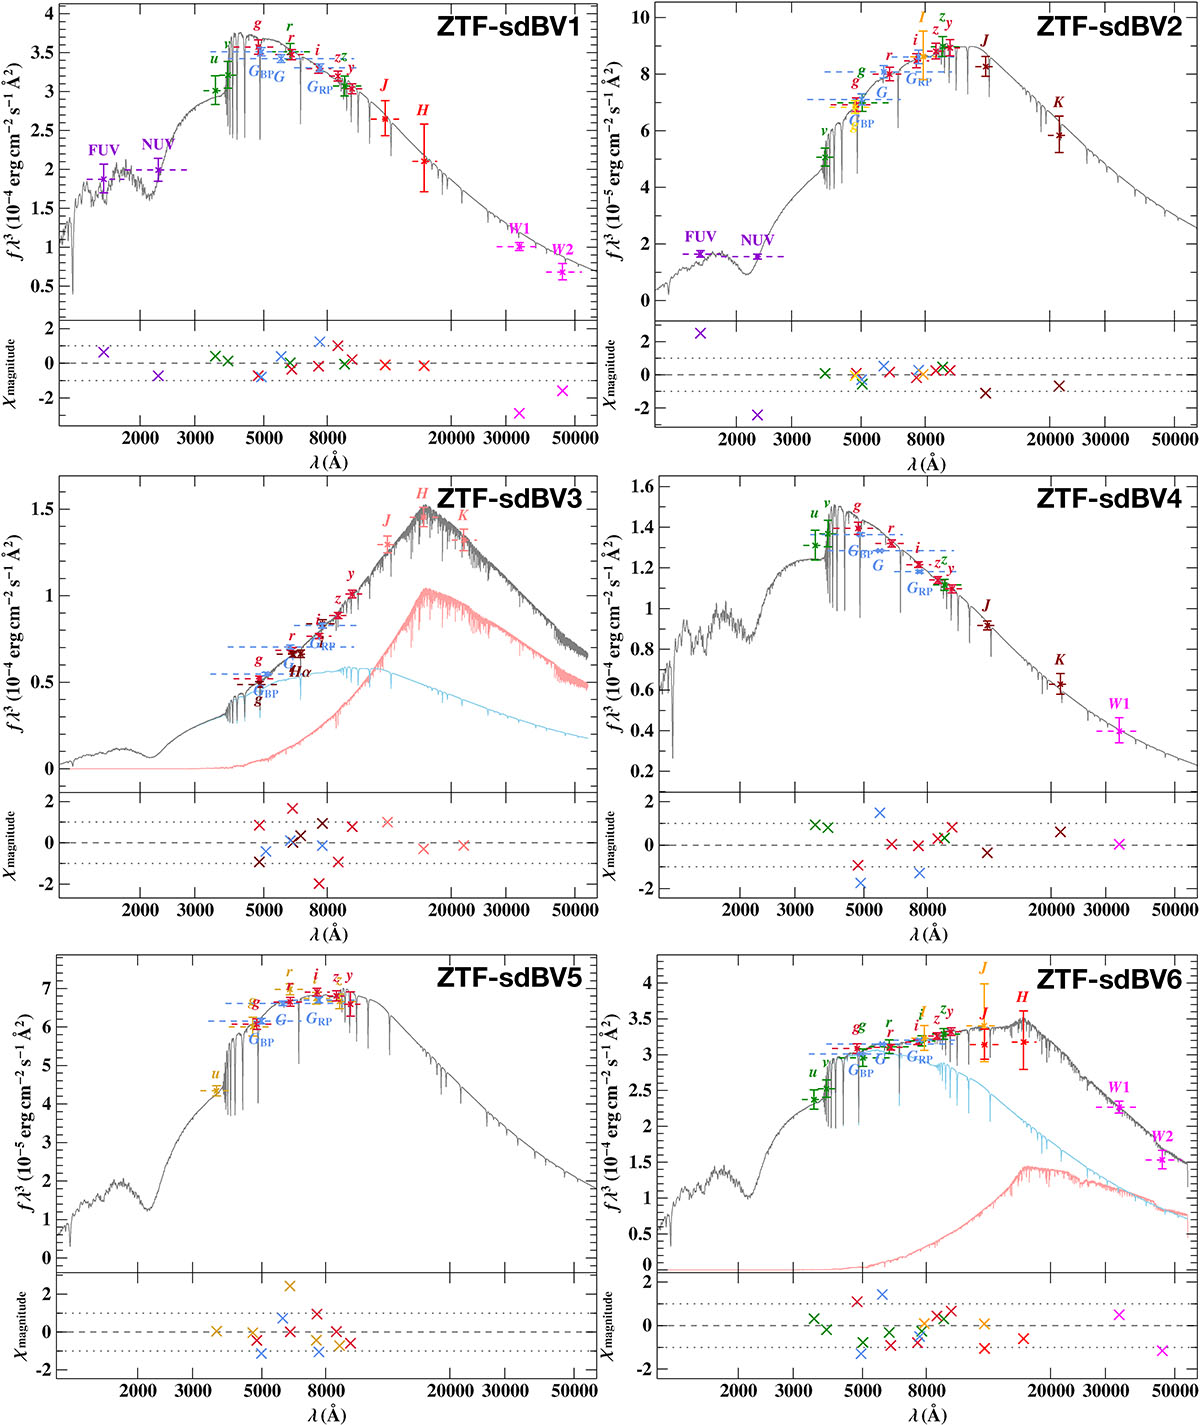
Spectral energy distribution fittings used to derive the reported fundamental properties. Photometric fluxes (colored points) are gathered from the sources listed above in Section C. The best fitting model spectrum (gray) is fit to the photometric data. For ZTF-sdBV3 and ZTF-sdBV6, a composite model is used consisting of a synthetic sdB spectrum (blue) and model PHEONIX spectrum (red).
Current usage metrics show cumulative count of Article Views (full-text article views including HTML views, PDF and ePub downloads, according to the available data) and Abstracts Views on Vision4Press platform.
Data correspond to usage on the plateform after 2015. The current usage metrics is available 48-96 hours after online publication and is updated daily on week days.
Initial download of the metrics may take a while.