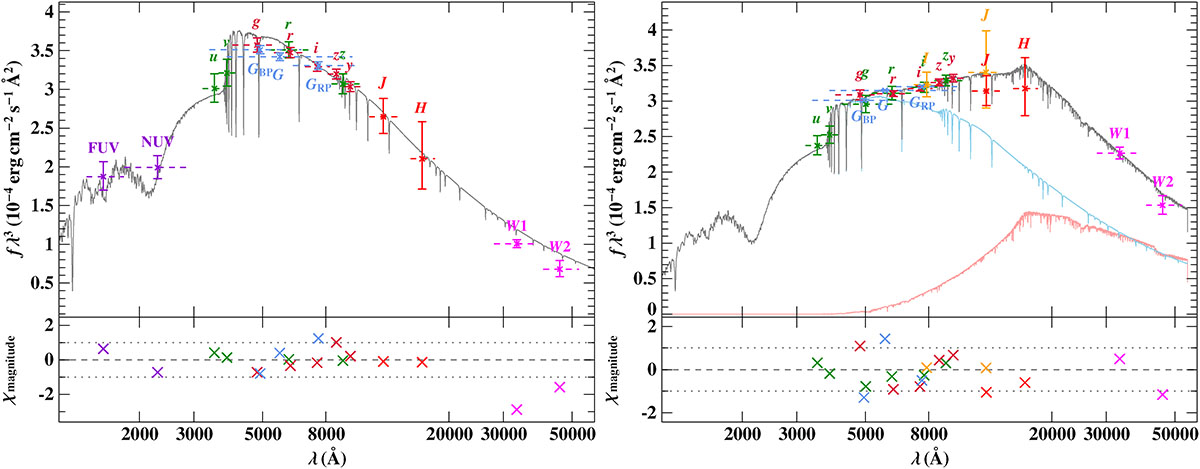
Fig. 2.
Download original image
Left panel: Spectral energy distribution fitting for a single sdB (ZTF-sdBV1) where the gray line represents the best fitting sdB model spectrum. Right panel: Composite spectral energy distribution fitting for an sdB + cool companion (ZTF-sdBV6) where the blue line denotes the sdB model and the red line shows the cool companion model from the PHOENIX grid, while the gray line is the composite spectrum. Colored points on both panels represent photometric flux measurements from a variety of sources, which are listed in Appendix C.
Current usage metrics show cumulative count of Article Views (full-text article views including HTML views, PDF and ePub downloads, according to the available data) and Abstracts Views on Vision4Press platform.
Data correspond to usage on the plateform after 2015. The current usage metrics is available 48-96 hours after online publication and is updated daily on week days.
Initial download of the metrics may take a while.