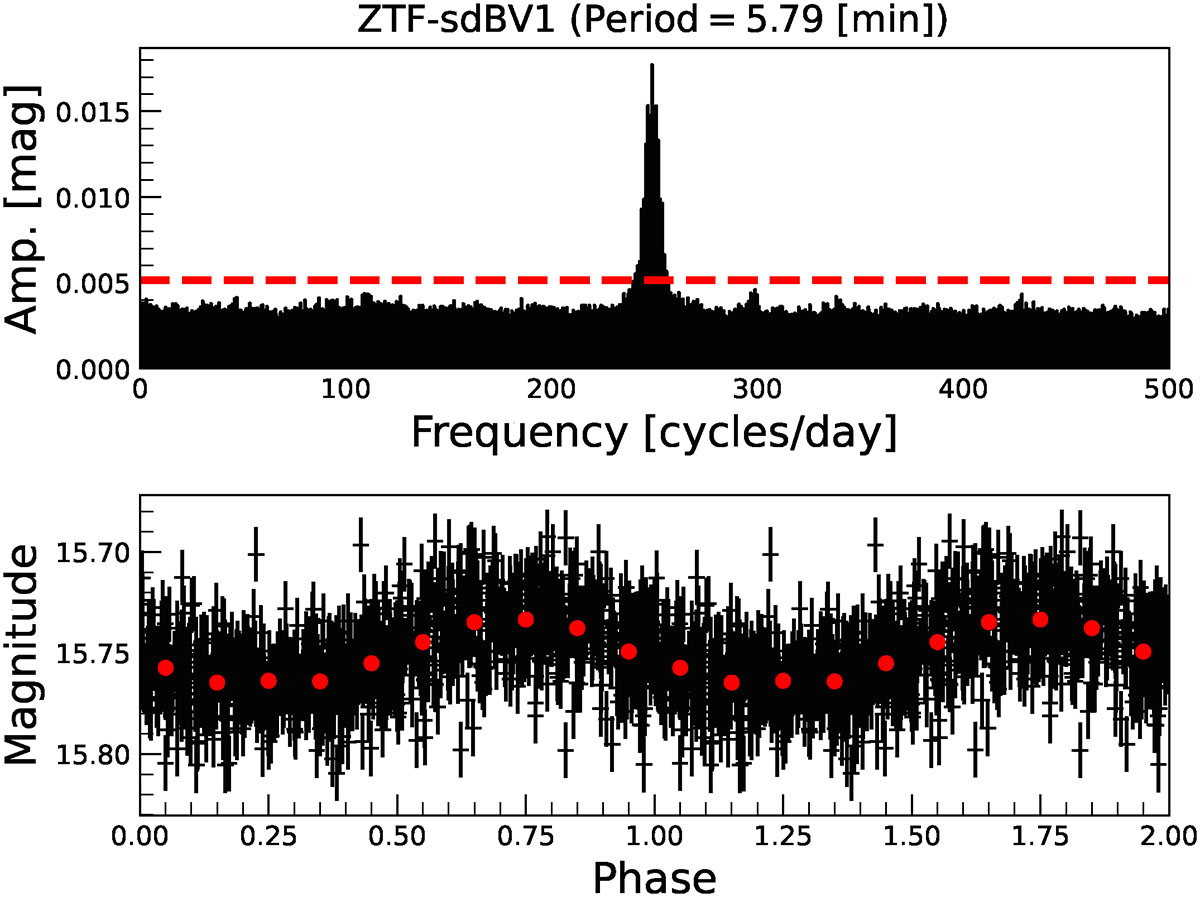
Fig. 3.
Download original image
Photometric results for a typical rm-sdBV (ZTF-sdBV1). Top panel: Resulting DFT frequency spectrum, after removing aliasing effects, plotted along with the 5σ detection level (red). Bottom panel: ZTF light curve (black), phase-folded on the detected frequency, overlaid with binned values (red), and plotted over two pulsation cycles for visualization.
Current usage metrics show cumulative count of Article Views (full-text article views including HTML views, PDF and ePub downloads, according to the available data) and Abstracts Views on Vision4Press platform.
Data correspond to usage on the plateform after 2015. The current usage metrics is available 48-96 hours after online publication and is updated daily on week days.
Initial download of the metrics may take a while.