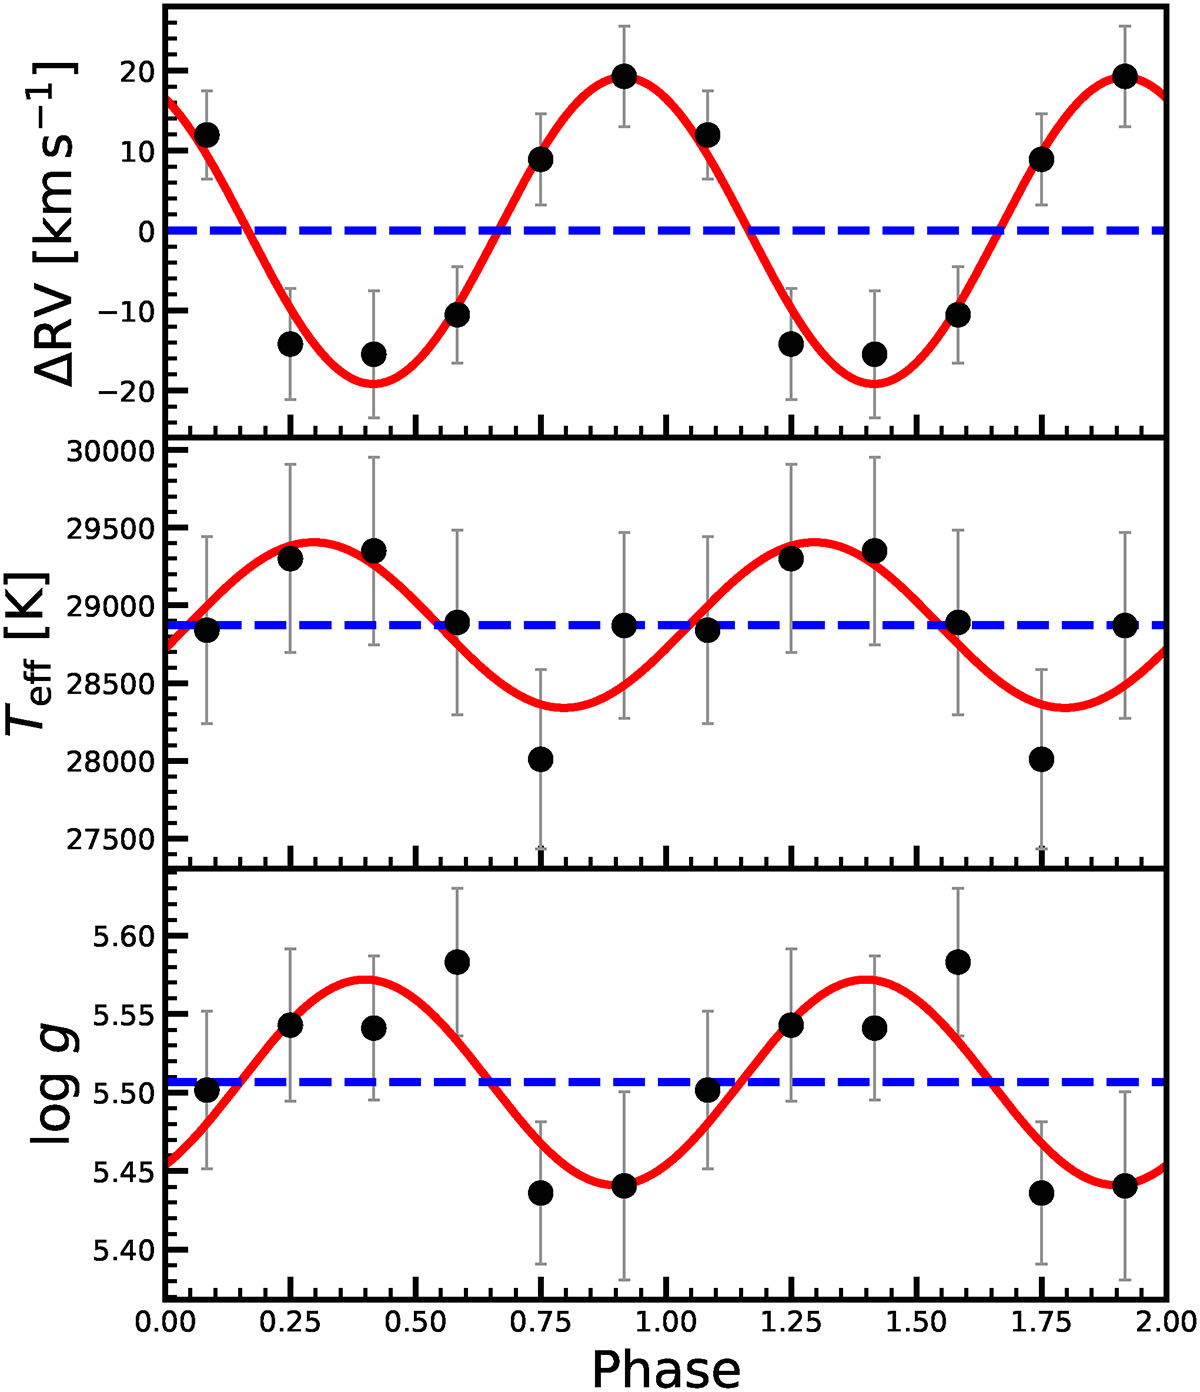
Fig. 5.
Download original image
Phase-resolved spectroscopic results for a typical rm-sdBV (ZTF-sdBV4). Top panel: Relative RV variations. Middle panel: Teff measurements. Bottom panel: Measurements of log g. The measured values (black) are shown along with their single harmonic fitting (red), around the mean value (blue). All results are plotted over two pulsation cycles for visualization.
Current usage metrics show cumulative count of Article Views (full-text article views including HTML views, PDF and ePub downloads, according to the available data) and Abstracts Views on Vision4Press platform.
Data correspond to usage on the plateform after 2015. The current usage metrics is available 48-96 hours after online publication and is updated daily on week days.
Initial download of the metrics may take a while.