Fig. 6.
Download original image
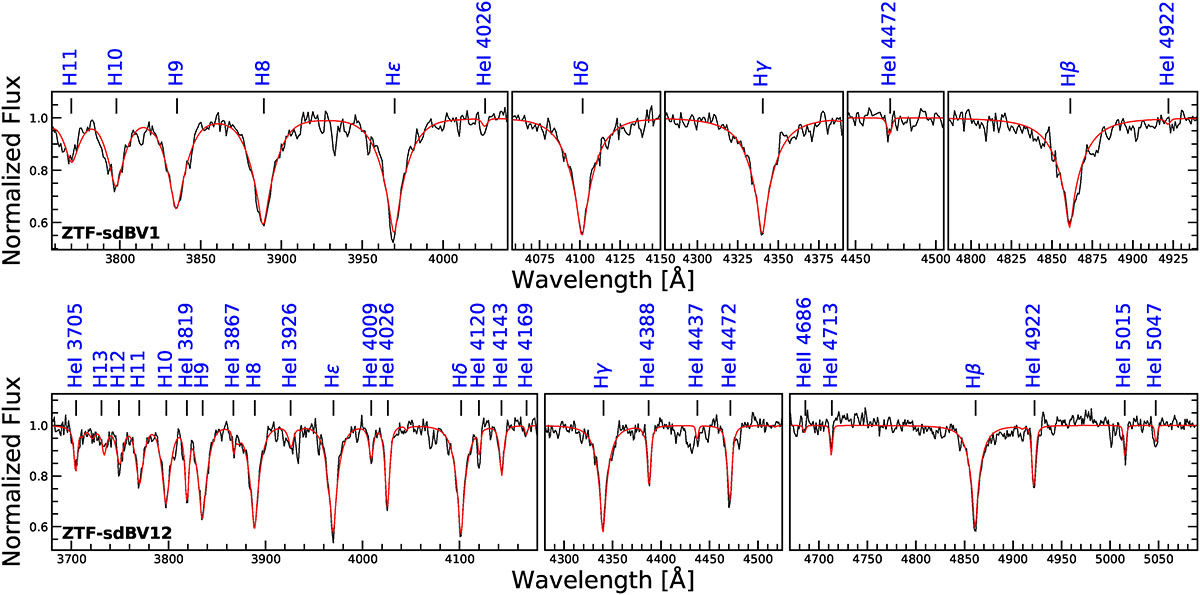
Spectroscopic model fitting (red) to the spectra (black) collected using SOAR/Goodman for two objects in our sample. Top panel: ZTF-sdBV1, a typical rm-sdBV spectrum. Bottom panel: ZTF-sdBV12, a spectrum revealing a BLAP atmosphere. Notable hydrogen and helium lines are marked above each panel, in blue, at their rest wavelengths.
Current usage metrics show cumulative count of Article Views (full-text article views including HTML views, PDF and ePub downloads, according to the available data) and Abstracts Views on Vision4Press platform.
Data correspond to usage on the plateform after 2015. The current usage metrics is available 48-96 hours after online publication and is updated daily on week days.
Initial download of the metrics may take a while.