Fig. 7.
Download original image
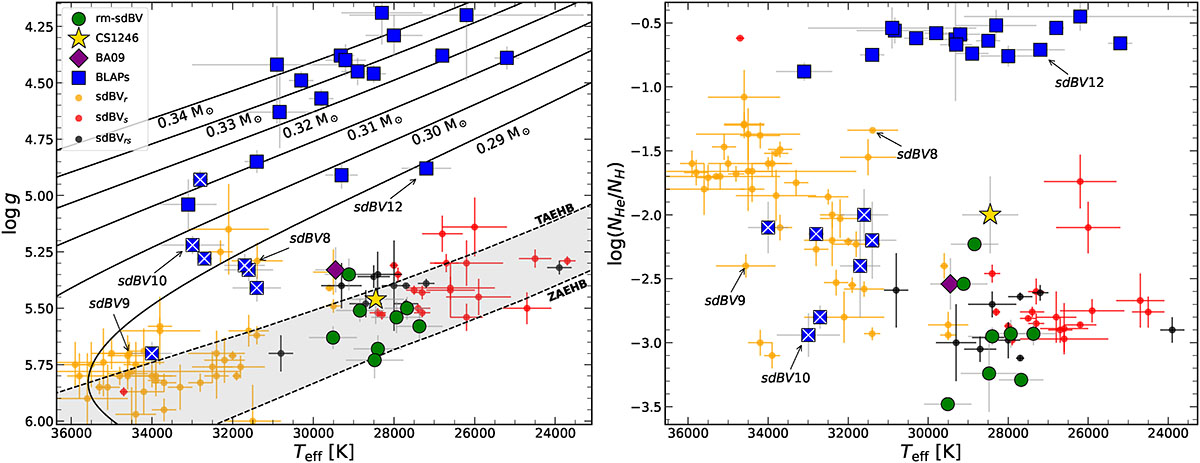
Left panel: Diagram of Teff – log g for sdB pulsators, including model tracks for the EHB (shaded gray; Dorman et al. 1993) and He-core pre-WDs with masses between 0.29–0.34 M⊙ (black lines; Kupfer et al. 2019). Right panel: Distribution of Teff – log(NHe/NH) for the same objects. The classified rm-sdBVs from ZTF are plotted with green circles along with CS 1246 and BA09, plotted using a gold star and purple diamond, respectively. Blue squares are the known BLAPs with atmospheric properties obtained from spectra; those marked with a white X represent He-poor (log(NHe/NH) < -1.5) BLAPs. Orange, red and black points represent sdBVr, sdBVs, and sdBVrs stars, respectively (sample from Holdsworth et al. 2017). Arrows with labels indicating the ZTF-sdBVs classified as a BLAP or sdBVr are included.
Current usage metrics show cumulative count of Article Views (full-text article views including HTML views, PDF and ePub downloads, according to the available data) and Abstracts Views on Vision4Press platform.
Data correspond to usage on the plateform after 2015. The current usage metrics is available 48-96 hours after online publication and is updated daily on week days.
Initial download of the metrics may take a while.