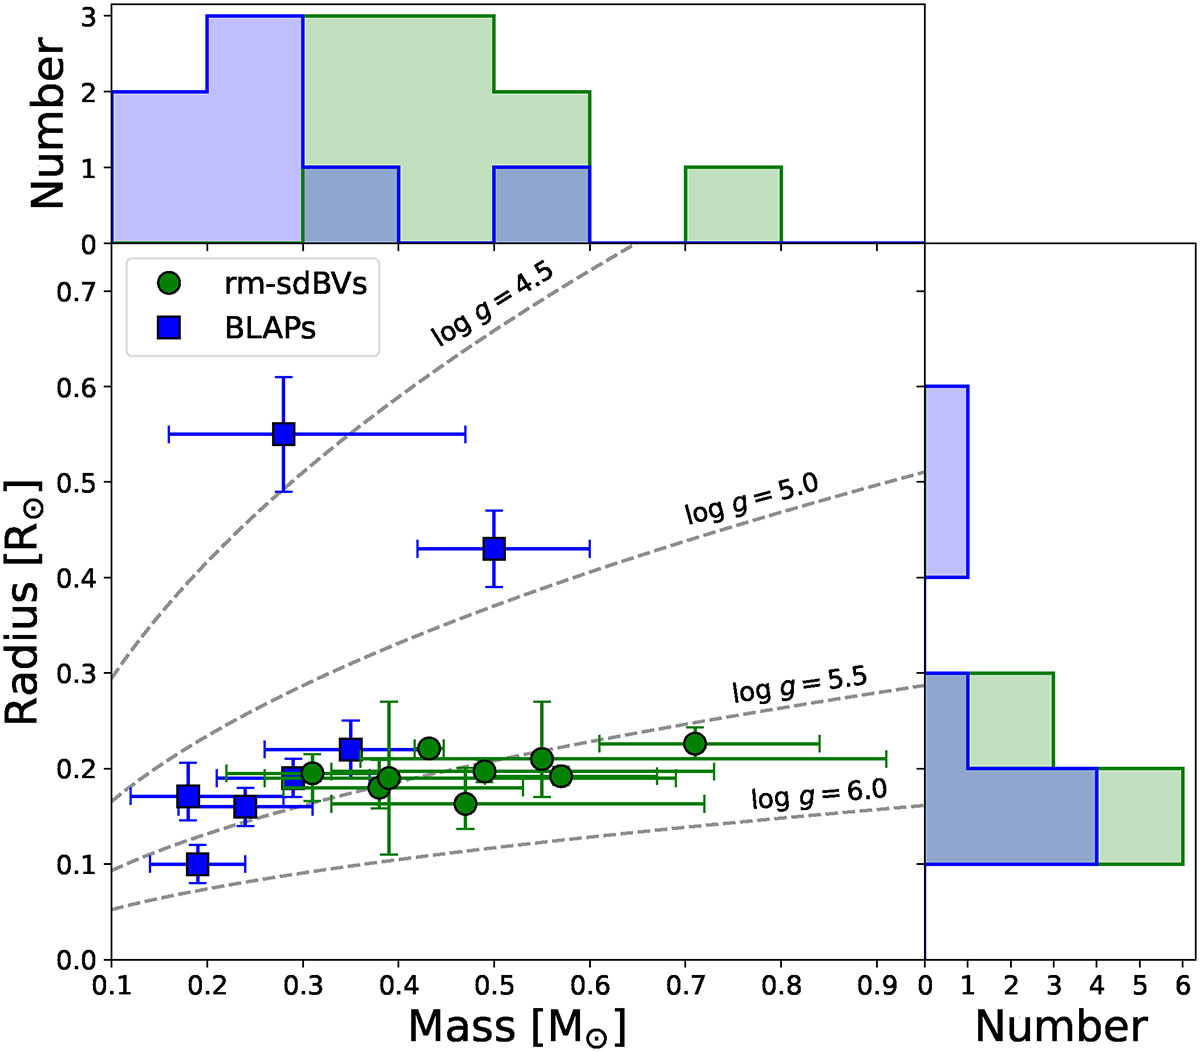
Fig. 8.
Download original image
Mass – radius distribution for the rm-sdBVs (green), which includes the properties of BA09 (Van Grootel et al. 2008) and CS 1246 (Barlow et al. 2010). The BLAPs (blue) with available mass and radius measurements from Kupfer et al. (2019) and Bradshaw et al. (2024), along with the two classified here (ZTF-sdBV10 and ZTF-sdBV12) are plotted for comparison. Lines of constant log g are drawn with gray dashed lines. Histograms of the mass and radius distributions for both populations are included, above the corresponding axis, in their respective colors.
Current usage metrics show cumulative count of Article Views (full-text article views including HTML views, PDF and ePub downloads, according to the available data) and Abstracts Views on Vision4Press platform.
Data correspond to usage on the plateform after 2015. The current usage metrics is available 48-96 hours after online publication and is updated daily on week days.
Initial download of the metrics may take a while.