Fig. 1
Download original image
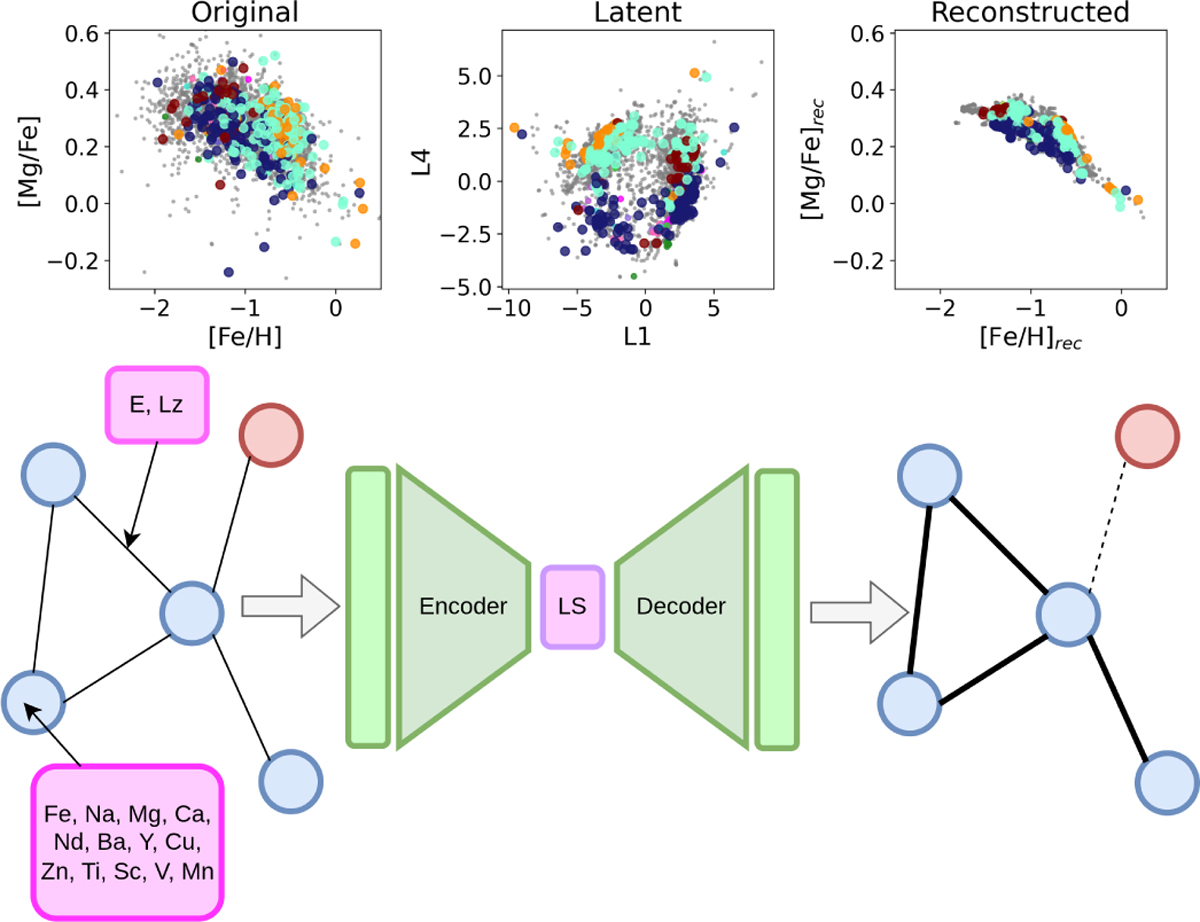
Schematic of the algorithm. Chemical abundances define node features, and IoM defines the edges. The GAT autoencoder reconstructs the node features, learning which links to retain or break. Chemically similar stars remain connected, while dissimilar ones disconnect. Top: original (left) vs. reconstructed abundances (right) with two of the five latent-space dimensions in the middle. This diagram was created with draw.io (JGraph 2021).
Current usage metrics show cumulative count of Article Views (full-text article views including HTML views, PDF and ePub downloads, according to the available data) and Abstracts Views on Vision4Press platform.
Data correspond to usage on the plateform after 2015. The current usage metrics is available 48-96 hours after online publication and is updated daily on week days.
Initial download of the metrics may take a while.