Fig. 2
Download original image
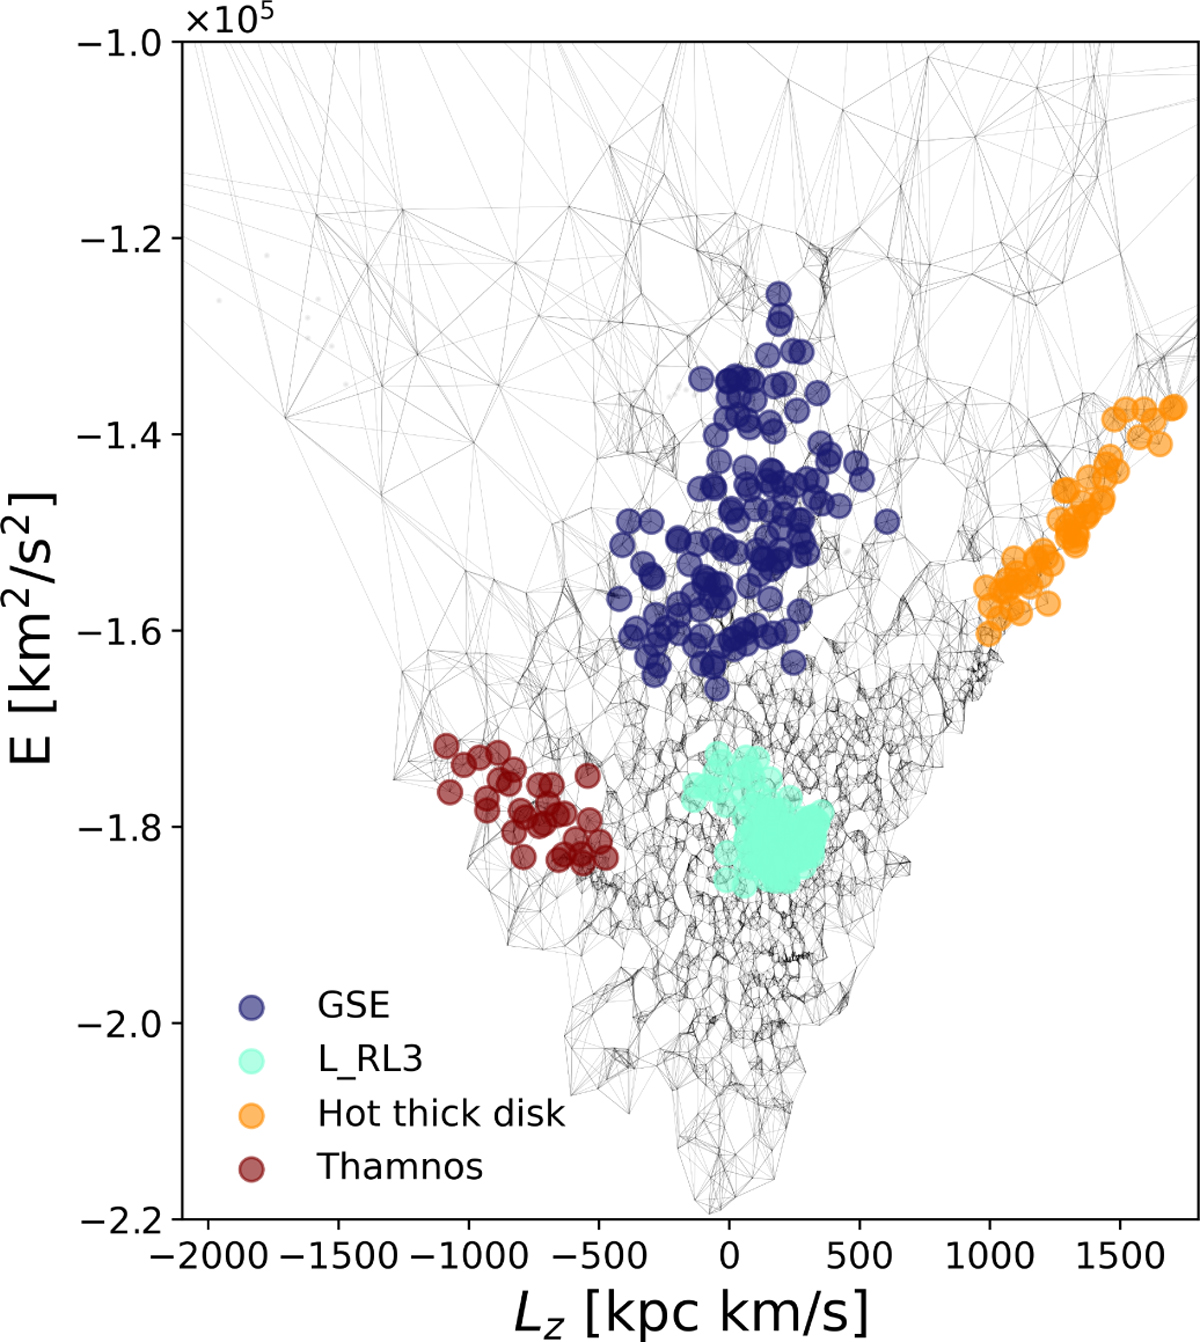
Lindblad diagram of the halo star sample used in this work. The four target streams identified in D23 are highlighted in color, while the GCs are shown as gray points for clarity, indistinguishable from the field stars. The edges of the graph are represented as gray lines, in which each edge links two stars from the selected GALAH DR4 sample.
Current usage metrics show cumulative count of Article Views (full-text article views including HTML views, PDF and ePub downloads, according to the available data) and Abstracts Views on Vision4Press platform.
Data correspond to usage on the plateform after 2015. The current usage metrics is available 48-96 hours after online publication and is updated daily on week days.
Initial download of the metrics may take a while.