Fig. 3
Download original image
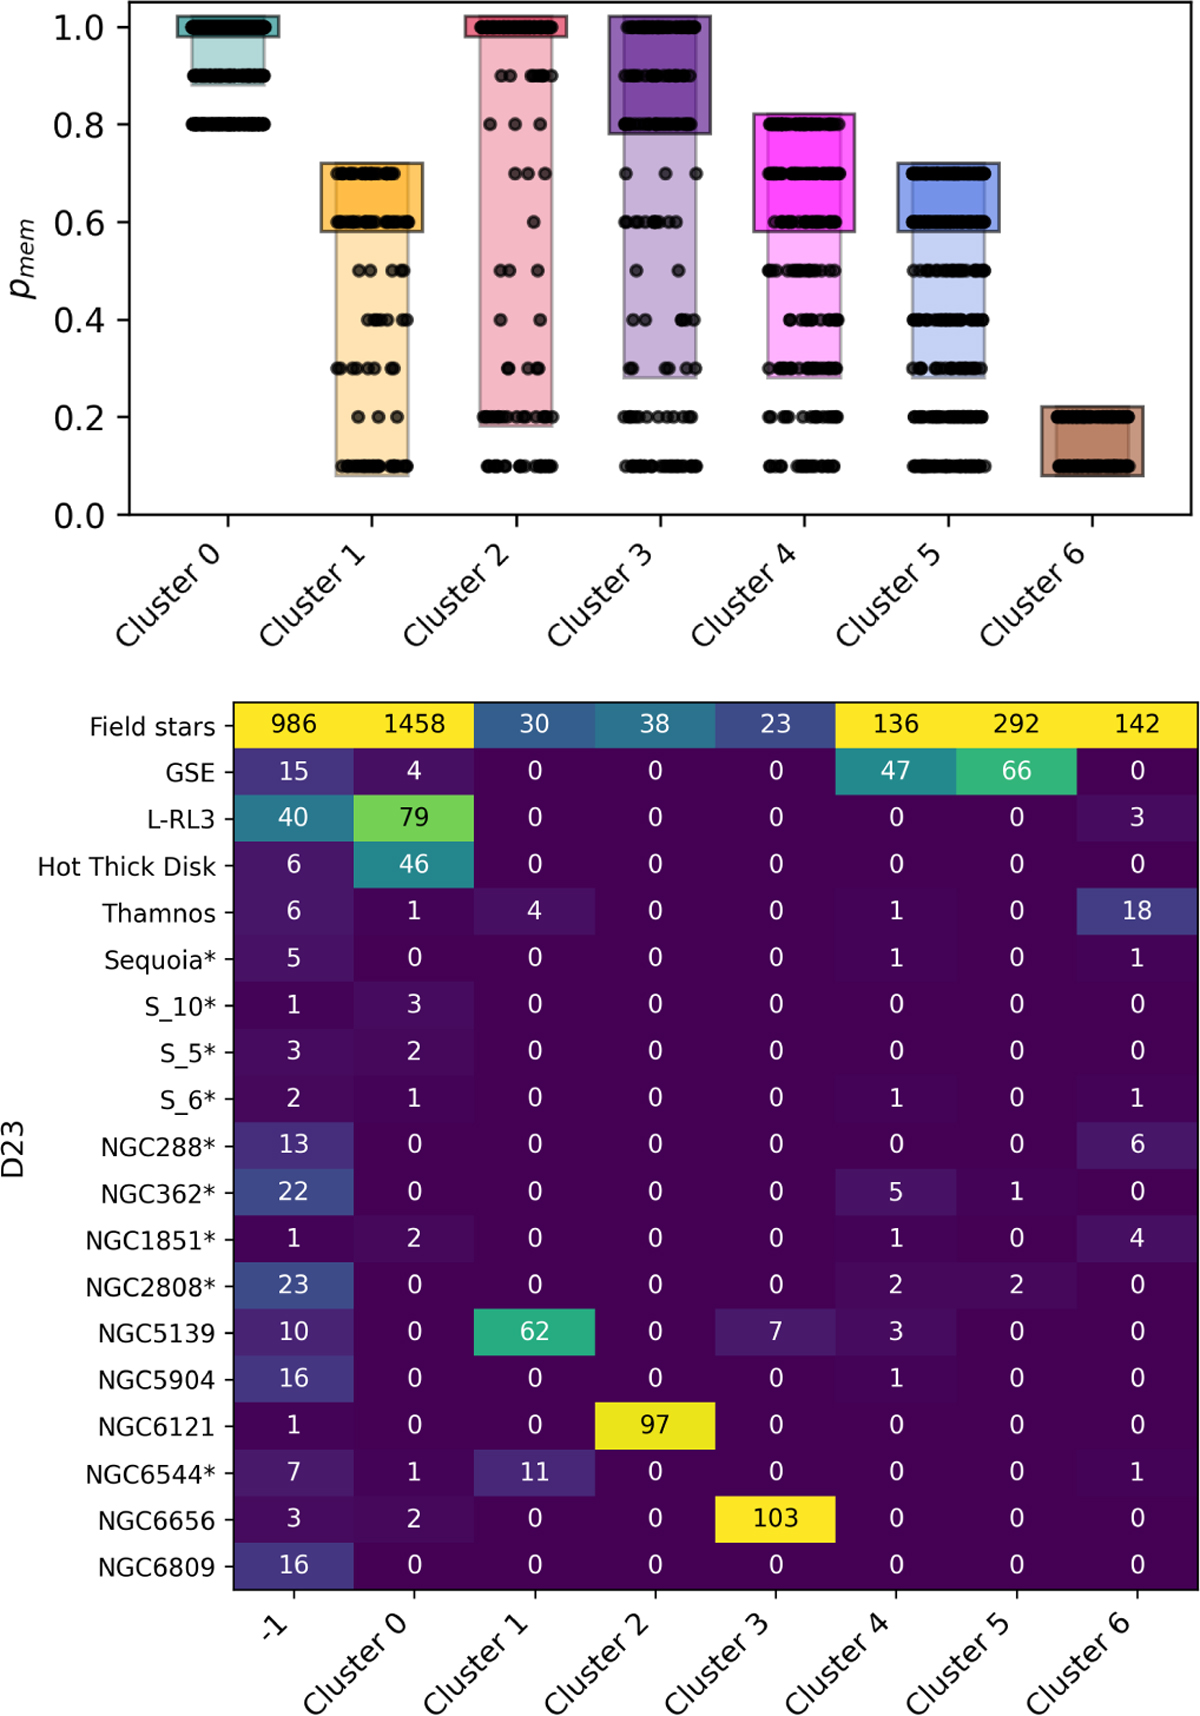
Top: membership probability distribution for the different clusters. For each cluster, the light rectangle shows the top 75% memberships, and the darker rectangle spans the top 50% (median). Individual stars are overplotted as black points. Bottom: cross-tab of cluster labels derived in this work vs. those from D23 and Lucatello et al. (in prep.). The heatmap shows the number of stars in each label combination.
Current usage metrics show cumulative count of Article Views (full-text article views including HTML views, PDF and ePub downloads, according to the available data) and Abstracts Views on Vision4Press platform.
Data correspond to usage on the plateform after 2015. The current usage metrics is available 48-96 hours after online publication and is updated daily on week days.
Initial download of the metrics may take a while.