Open Access
Fig. 4
Download original image
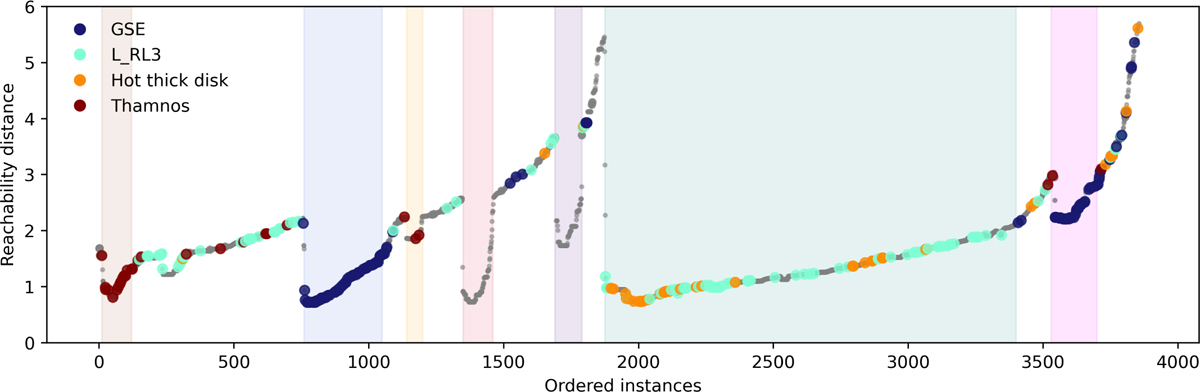
Reachability plot of all identified clusters. Streams from D23 are colored according to the palette used in their work. The gray points represent field stars, which contain hidden GCs. Shaded areas indicate the approximate locations of the consensus clusters identified in this work.
Current usage metrics show cumulative count of Article Views (full-text article views including HTML views, PDF and ePub downloads, according to the available data) and Abstracts Views on Vision4Press platform.
Data correspond to usage on the plateform after 2015. The current usage metrics is available 48-96 hours after online publication and is updated daily on week days.
Initial download of the metrics may take a while.