Fig. 8
Download original image
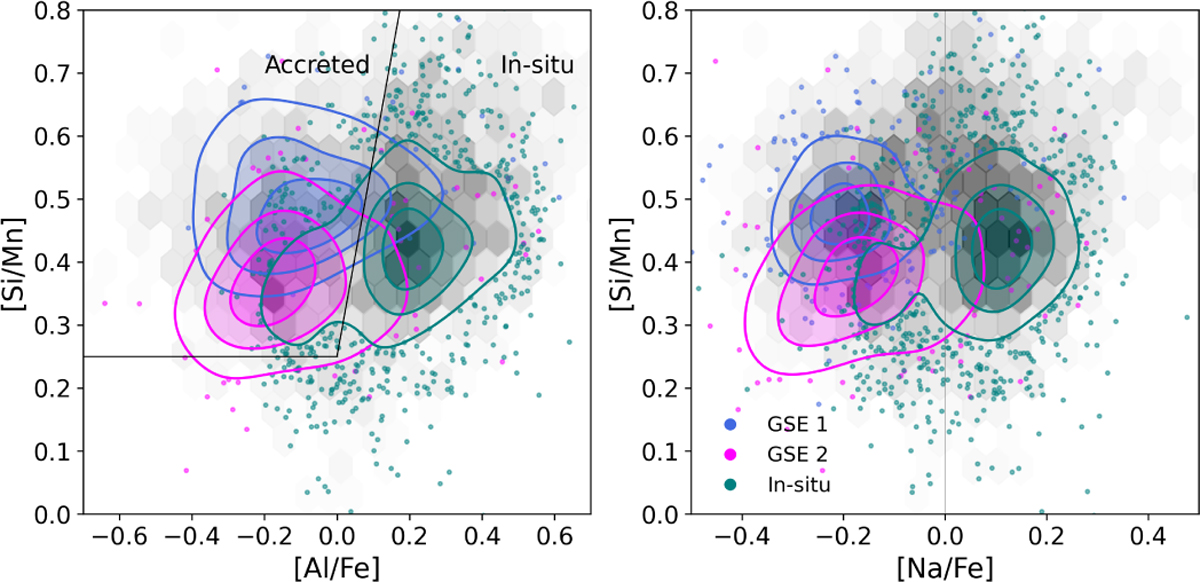
Left: [Si/Mn] vs. [Al/Fe] abundance plane for the two clusters associated with GSE and the in situ sample. The three highest-density levels are shown with filled contours (spanning from 60% to 100% of the peak KDE density), while stars outside these regions are plotted as scatter points to highlight lower-density members. Black lines denote limits commonly adopted in the literature. Right: same for [Si/Mn] vs. [Na/Fe], with a gray line at solar.
Current usage metrics show cumulative count of Article Views (full-text article views including HTML views, PDF and ePub downloads, according to the available data) and Abstracts Views on Vision4Press platform.
Data correspond to usage on the plateform after 2015. The current usage metrics is available 48-96 hours after online publication and is updated daily on week days.
Initial download of the metrics may take a while.