Fig. 9
Download original image
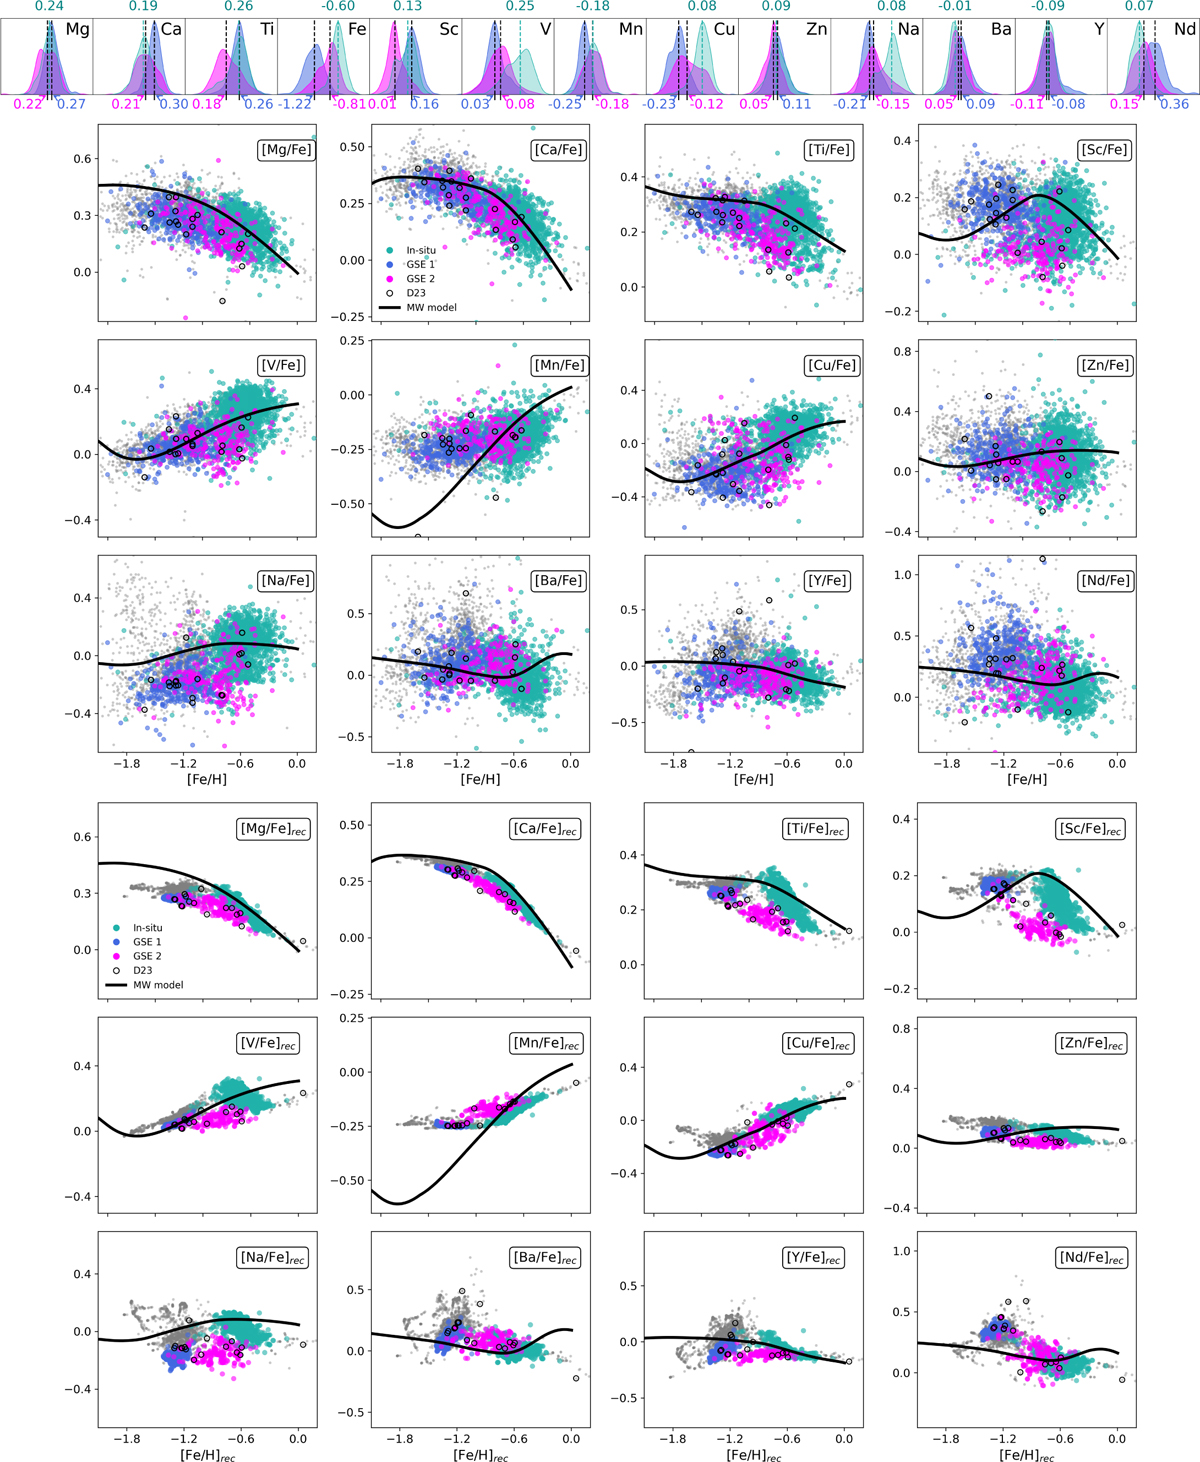
Top: KDE histograms and median abundances (in [dex], dashed lines) for all elements across the GSE and in situ clusters. Middle: original elemental abundances compared to Galactic chemical evolution models (Romano et al. 2010, 2019). The models are y-shifted to match the Hot Thick Disk baseline. Background stars are shown in gray, while colored points indicate cluster members. The black-edged symbols represent stars identified as GSE in D23 but not recovered in this work. Bottom: same as the middle panel, but utilizing GAT-reconstructed abundances.
Current usage metrics show cumulative count of Article Views (full-text article views including HTML views, PDF and ePub downloads, according to the available data) and Abstracts Views on Vision4Press platform.
Data correspond to usage on the plateform after 2015. The current usage metrics is available 48-96 hours after online publication and is updated daily on week days.
Initial download of the metrics may take a while.