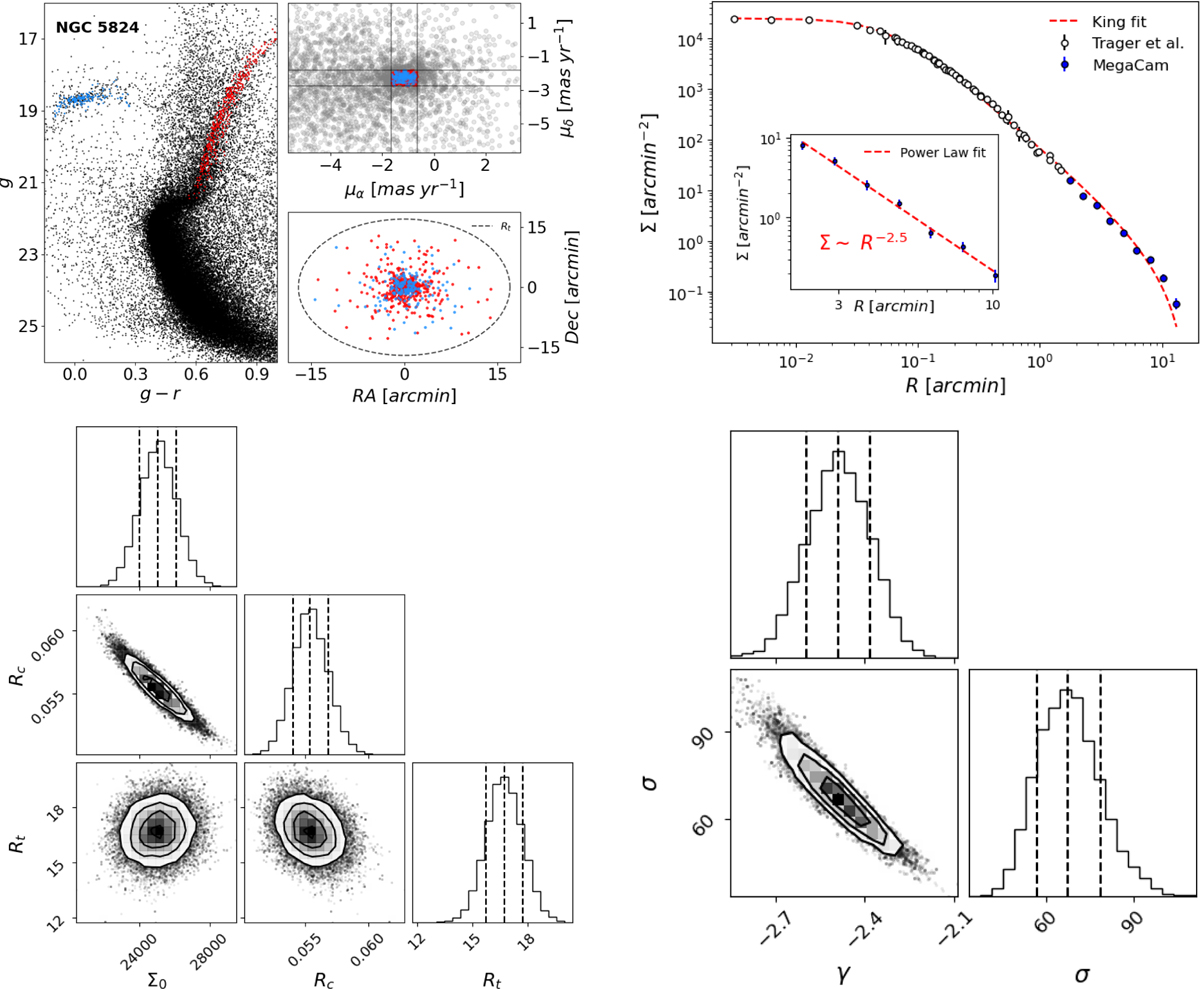
Fig. A.1
Download original image
Same as Fig. 4 but for Test 2, which uses MegaCam photometry and Gaia proper motions. The top-left panel includes a proper motion diagram where gray dots represent the full dataset with PM measurements, and red and blue dots correspond to the RGB and BHB stars candidates, respectively, which are also shown in the CMD and star-count map.
Current usage metrics show cumulative count of Article Views (full-text article views including HTML views, PDF and ePub downloads, according to the available data) and Abstracts Views on Vision4Press platform.
Data correspond to usage on the plateform after 2015. The current usage metrics is available 48-96 hours after online publication and is updated daily on week days.
Initial download of the metrics may take a while.