Fig. 4
Download original image
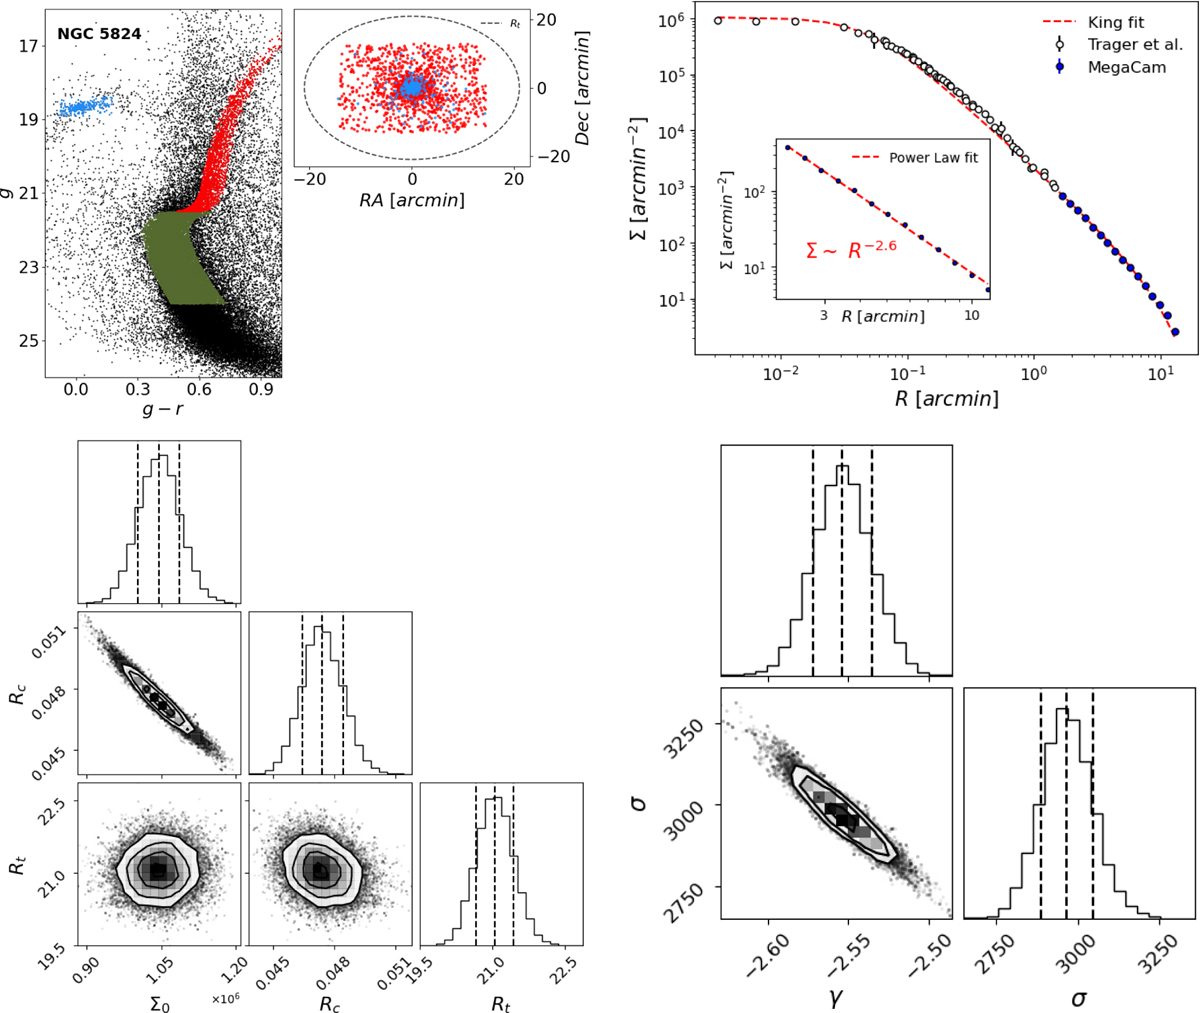
NGC 5824 results for Test 1. Top left: CMD and a star-count map of the cluster. Green, red, and blue dots correspond to the MS, RGB, and BHB star candidates, respectively, and the gray circle represents the best.fit Rt parameter for this test. Note that MS candidates are omitted from the star-count map because they occupy the entire MegaCam field. Top right: Observed surface number density profile, constructed using MS, RGB, and BHB stars, along with data from Trager et al. (1995) for the cluster’s innermost region. Bottom left and bottom right: corner plots obtained for the King profile and power-law fits, respectively. The dashed black lines correspond to percentiles 0.16, 0.5, and 0.83, in that order, from left to right. Rc and Rt are expressed in arcminutes. Σ0 is expressed in arcmin−2. γ is dimensionless, and σ is a normalization factor of the power-law model.
Current usage metrics show cumulative count of Article Views (full-text article views including HTML views, PDF and ePub downloads, according to the available data) and Abstracts Views on Vision4Press platform.
Data correspond to usage on the plateform after 2015. The current usage metrics is available 48-96 hours after online publication and is updated daily on week days.
Initial download of the metrics may take a while.