Fig. 2
Download original image
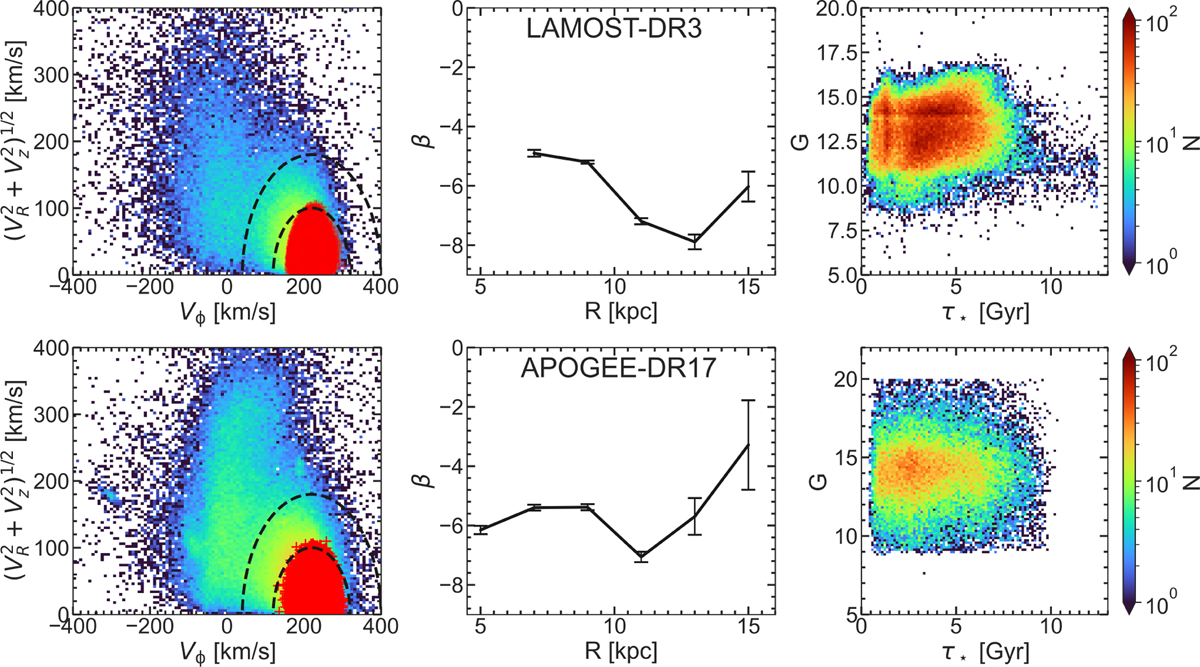
Left: Toomre diagrams showing the kinematics of the uncleaned LAMOST-DR3 (top row) and APOGEE-DR17 (bottom row) catalogues, (blue/green distribution) with the stars satisfying λc > 0.9 and |z| < 0.3 kpc over-plotted with red markers. The inner and outer dashed curves represent the boundaries between the kinematically defined thin/thick discs and halo. Middle: Orbital anisotropy, β, of the cleaned sub-sample with errors determined via a bootstrapping method. The negative value of β indicates that the population is tangentially biased. Right: distribution of apparent Gaia G-band magnitude versus stellar age, τ⋆, for the cleaned sub-samples.
Current usage metrics show cumulative count of Article Views (full-text article views including HTML views, PDF and ePub downloads, according to the available data) and Abstracts Views on Vision4Press platform.
Data correspond to usage on the plateform after 2015. The current usage metrics is available 48-96 hours after online publication and is updated daily on week days.
Initial download of the metrics may take a while.