Fig. 5
Download original image
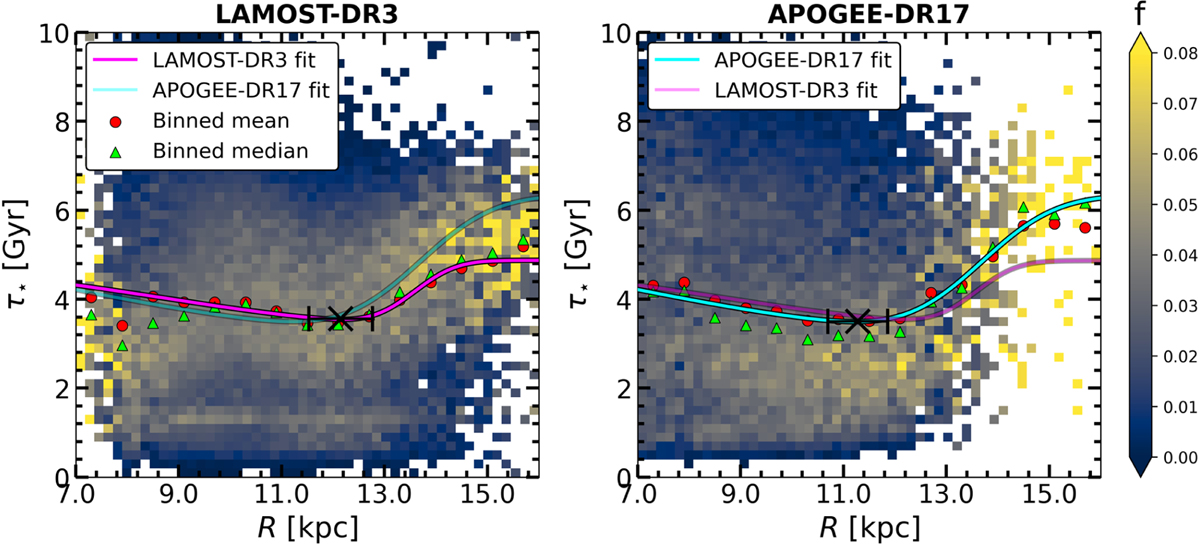
Column-normalised 2D histograms of the stellar age distribution, τ⋆(R), for the LAMOST-DR3 (left) and APOGEE-DR17 (right) samples. The red and green markers show the mean and median profiles, respectively. The solid curves show the age profile resulting from the maximum-likelihood fitting (this fits to all individual sources without binning – see text for details). In each panel, we also cross-plot the ML fit of the dataset in the opposite panel for comparison. The black marker reflects the location of the maximum-likelihood age minimum and associated uncertainty.
Current usage metrics show cumulative count of Article Views (full-text article views including HTML views, PDF and ePub downloads, according to the available data) and Abstracts Views on Vision4Press platform.
Data correspond to usage on the plateform after 2015. The current usage metrics is available 48-96 hours after online publication and is updated daily on week days.
Initial download of the metrics may take a while.