Open Access
Fig. 6
Download original image
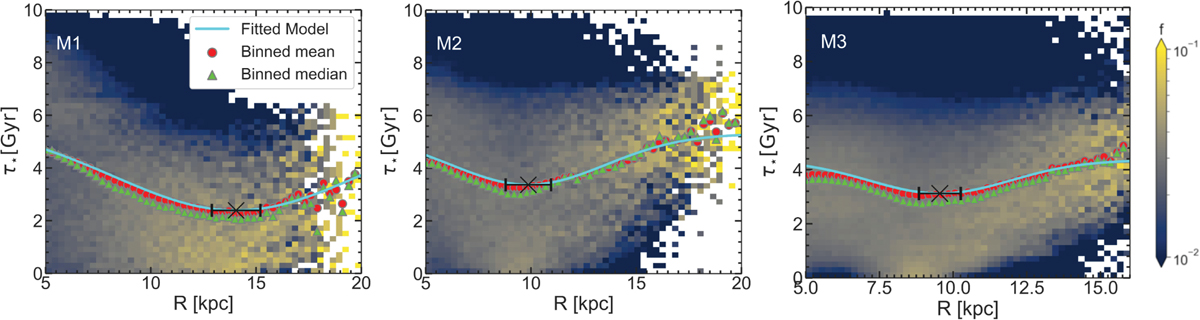
Column-normalised stellar age distribution of the models. The red and green marker points show the mean and median stellar age profiles, respectively. The solid cyan line shows the final age profile, τ⋆, resulting from the ML fitting. The black point shows the position and associated uncertainty of Rmin as determined by ![]() .
.
Current usage metrics show cumulative count of Article Views (full-text article views including HTML views, PDF and ePub downloads, according to the available data) and Abstracts Views on Vision4Press platform.
Data correspond to usage on the plateform after 2015. The current usage metrics is available 48-96 hours after online publication and is updated daily on week days.
Initial download of the metrics may take a while.