Fig. 7
Download original image
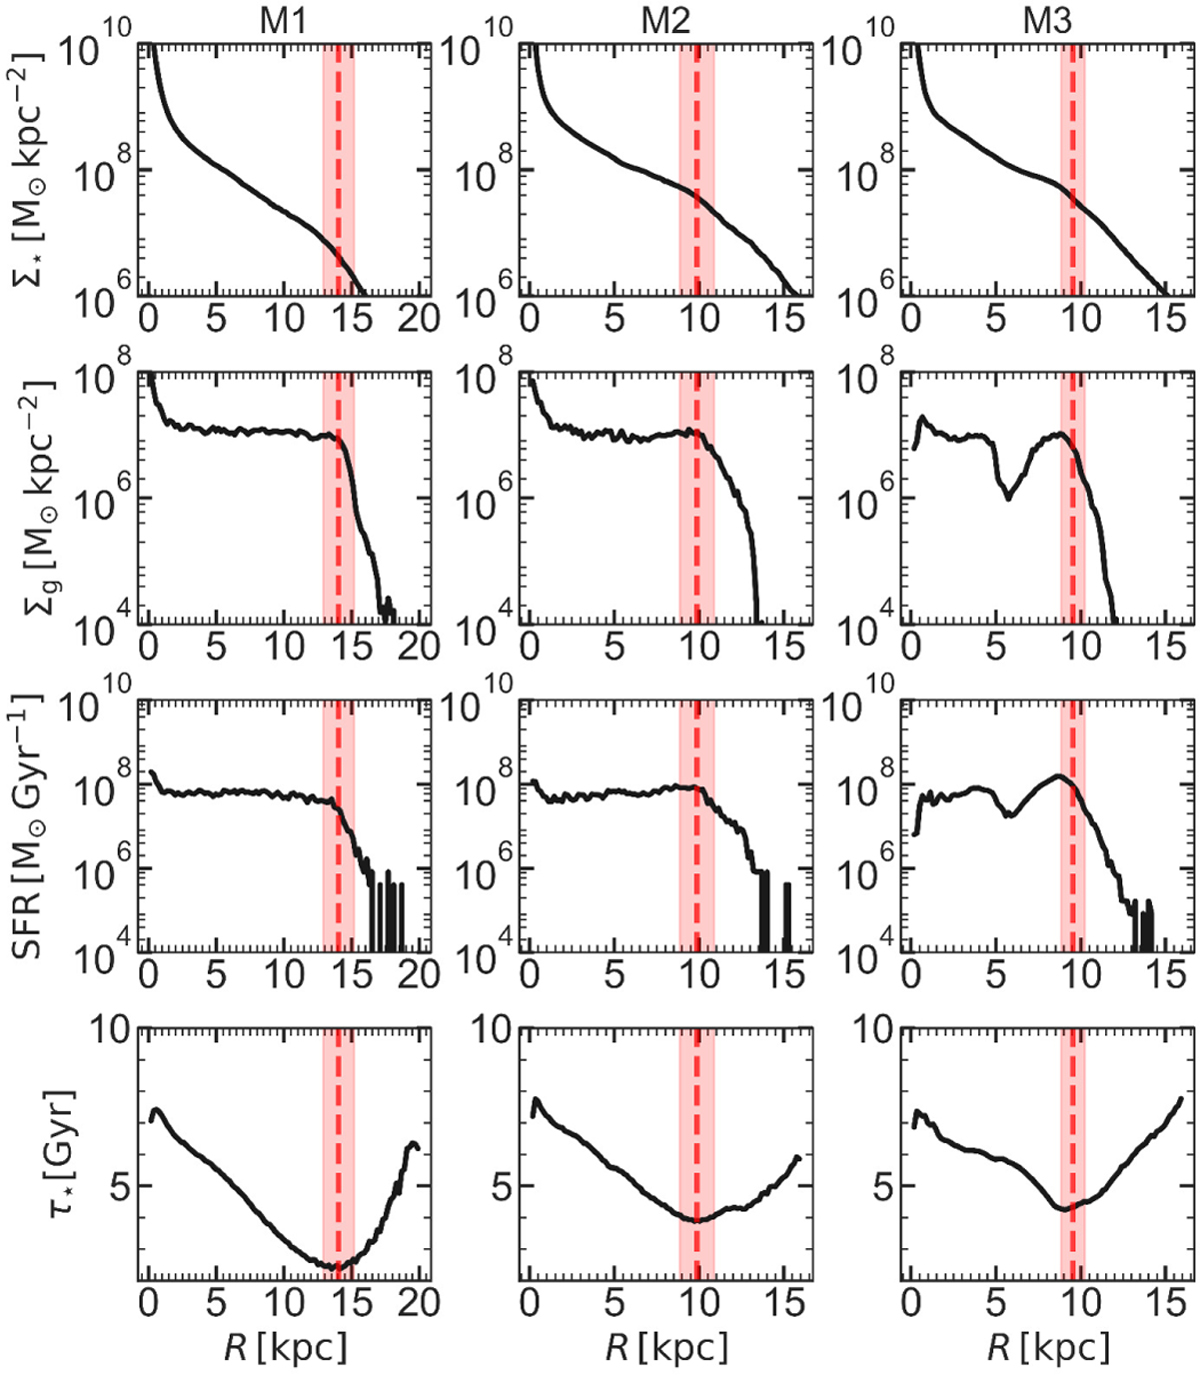
Top row: radial stellar density profiles for the models. Second row: cold gas (T < 15 000 K) density profile. Third row: star formation rate profile. Bottom row: mean stellar age profile. The vertical dashed red lines show the location of the age minimum for each model, with the red shaded region highlighting the uncertainty of the minimum. In each of our models, Rmin coincides with a drop in the gas volume density, SFR, and the break in the stellar density profile (within the error).
Current usage metrics show cumulative count of Article Views (full-text article views including HTML views, PDF and ePub downloads, according to the available data) and Abstracts Views on Vision4Press platform.
Data correspond to usage on the plateform after 2015. The current usage metrics is available 48-96 hours after online publication and is updated daily on week days.
Initial download of the metrics may take a while.