Fig. 8
Download original image
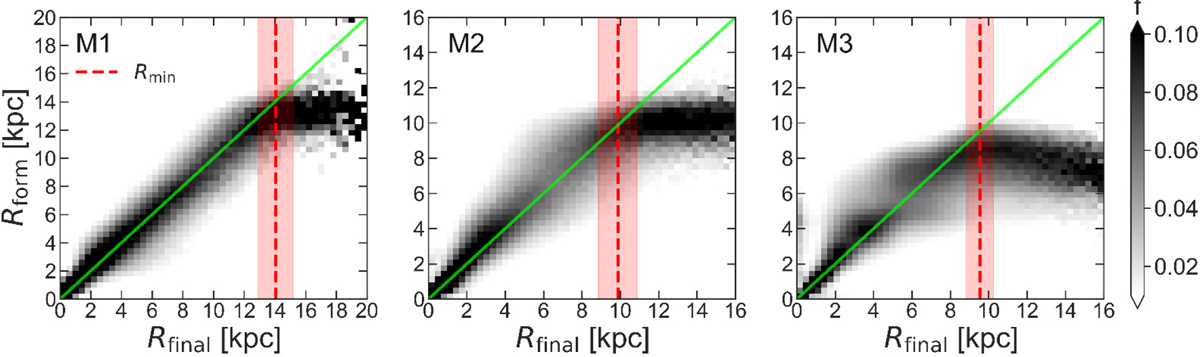
Column-normalised 2D histogram of stellar birth radius versus final radius at 10 Gyr for the models. Stars here satisfy |z| < 0.3 kpc and λc > 0.9. The solid green and dashed red lines reflect the 1 : 1 relation and the location of the age upturn, respectively. While the distribution follows the 1 : 1 line in the inner disc, we find a knee in the distribution near the age upturn. Stars beyond the age upturn were born in the inner disc and subsequently migrated outwards.
Current usage metrics show cumulative count of Article Views (full-text article views including HTML views, PDF and ePub downloads, according to the available data) and Abstracts Views on Vision4Press platform.
Data correspond to usage on the plateform after 2015. The current usage metrics is available 48-96 hours after online publication and is updated daily on week days.
Initial download of the metrics may take a while.