Fig. 5
Download original image
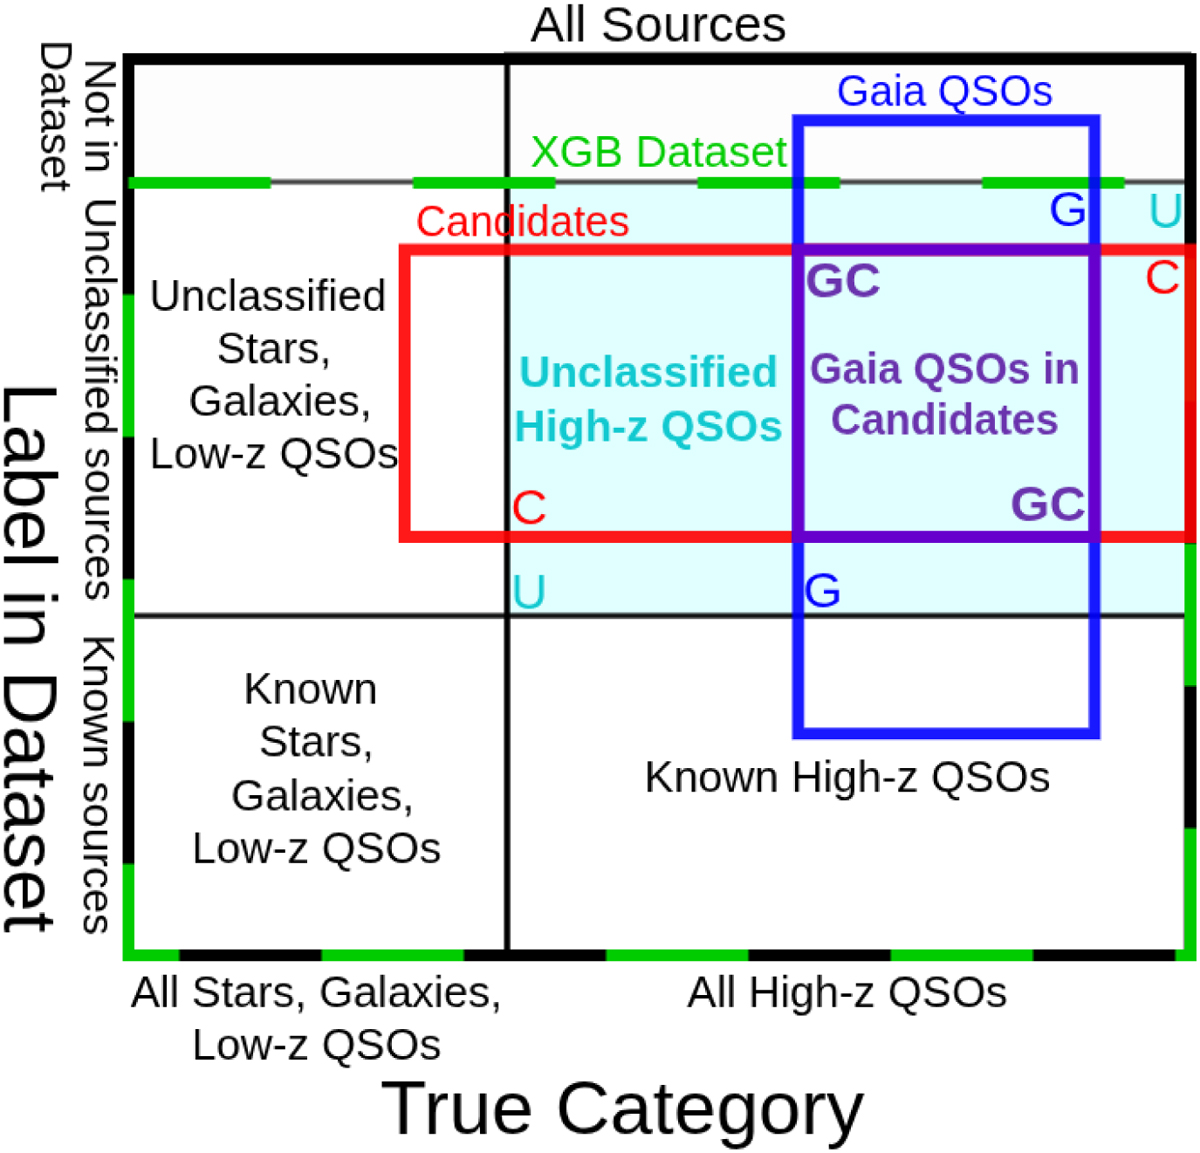
Schematic representation of the datasets used in the QUBRICS survey and in this paper. The outermost black rectangle contains all the sources within a given footprint and magnitude range. The dashed green rectangle denotes the dataset used in the XGB selection. Vertical divisions separate the sources according to their true category, while horizontal divisions separate the sources according to their label in the database. Known uninteresting sources (stars, galaxies, and low-redshift QSOs) are in the bottom-left quadrant. Known high-redshift QSOs are in the bottom-right quadrant. Unclassified sources that are stars, galaxies, or low-redshift QSOs are in the top-left quadrant. Unclassified sources that are high-redshift QSOs are in the top right. The region of interest is highlighted in cyan and by the letter U: this is the set of all true high-redshift QSOs that are unclassified in the dataset. The red rectangle represents the set of QSO candidates predicted by the XGB technique, and its intersection C with the U region is the set of unclassified high-redshift QSOs that are also candidates. The blue rectangle represents the set of Gaia QSOs, and its intersection G with the cyan U region is the set of Gaia QSOs that are unclassified in the dataset.
Current usage metrics show cumulative count of Article Views (full-text article views including HTML views, PDF and ePub downloads, according to the available data) and Abstracts Views on Vision4Press platform.
Data correspond to usage on the plateform after 2015. The current usage metrics is available 48-96 hours after online publication and is updated daily on week days.
Initial download of the metrics may take a while.