Open Access
Fig. 6
Download original image
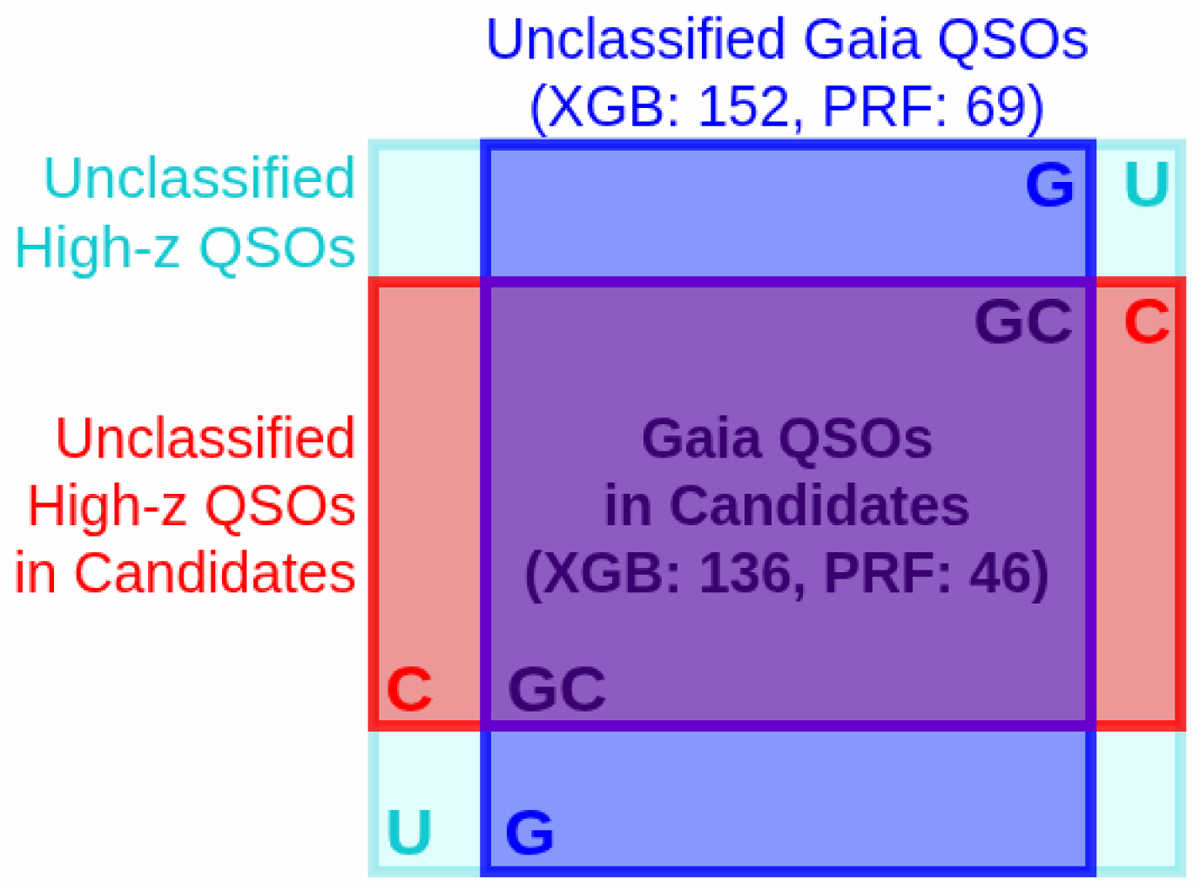
Zoomed-in view of the region of interest (U) in Fig. 5. The intersection GC between the blue and red rectangles is the set of unclassified high-redshift QSOs in the dataset that are both QSO candidates and in the Gaia QSO sample. Completeness and recall metrics are defined in terms of these intersections in Sect. 6.
Current usage metrics show cumulative count of Article Views (full-text article views including HTML views, PDF and ePub downloads, according to the available data) and Abstracts Views on Vision4Press platform.
Data correspond to usage on the plateform after 2015. The current usage metrics is available 48-96 hours after online publication and is updated daily on week days.
Initial download of the metrics may take a while.