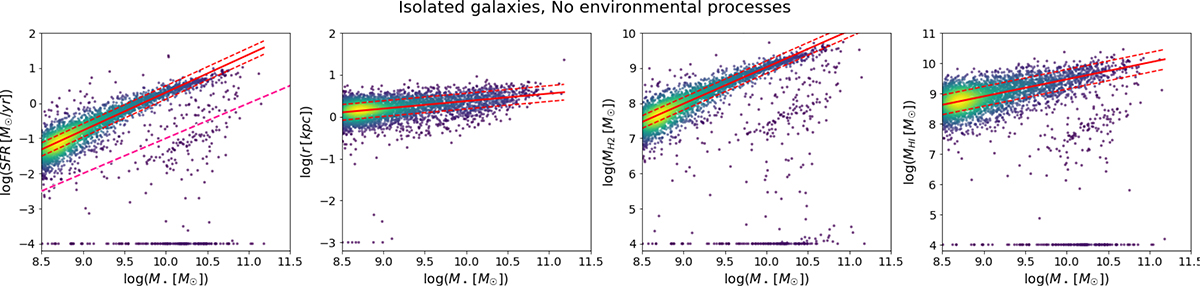
Fig. 10.
Download original image
Scaling relations investigated here as a function of environment and process. From left to right: SFR-mass, size-mass, H2-mass, and HI-mass. Only isolated galaxies with no process are considered and the best fit of the relation is shown. This line is used as reference in the following analysis. In the SFR-mass plot, the separation used to identify star forming and passive galaxies (log(SSFR[yr−1]) = −11) is also shown.
Current usage metrics show cumulative count of Article Views (full-text article views including HTML views, PDF and ePub downloads, according to the available data) and Abstracts Views on Vision4Press platform.
Data correspond to usage on the plateform after 2015. The current usage metrics is available 48-96 hours after online publication and is updated daily on week days.
Initial download of the metrics may take a while.