Fig. 16.
Download original image
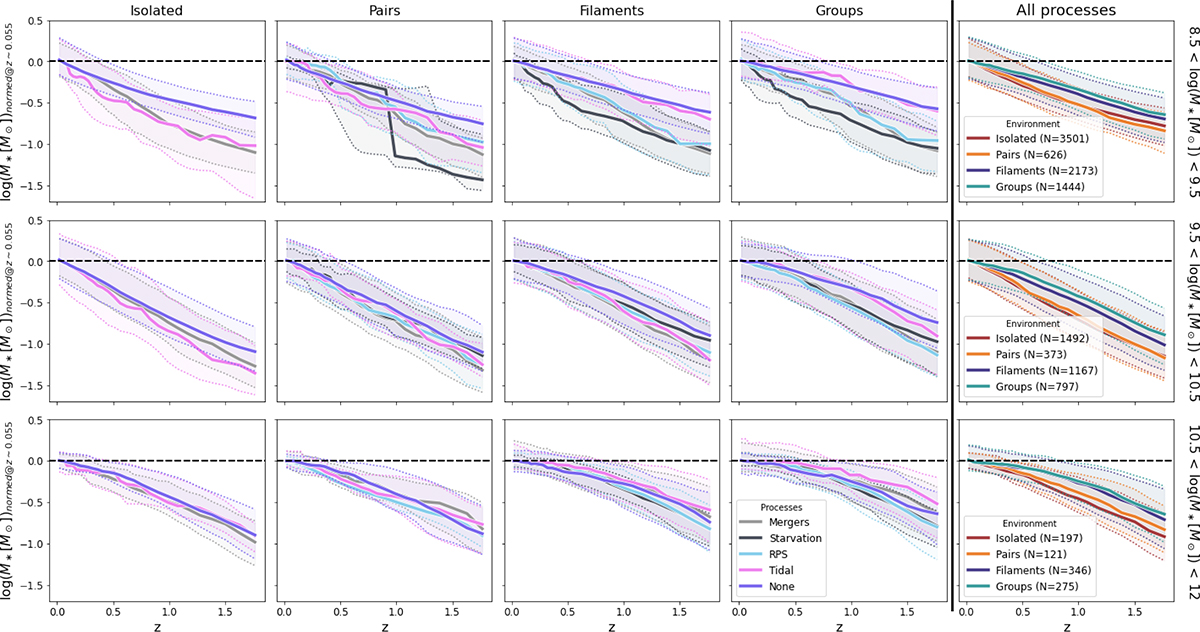
Stellar mass growth as a function of time for galaxies in different environments (from the first to the fourth columns), undergoing different mechanisms (as indicated in the legend in the panel in the bottom row, fourth column) and in three different stellar mass bins. Lines are normalized to the z = 0.05 galaxy mass. Solid colored lines represent the median values, considering all galaxies in all sub-boxes. Shaded regions show the 25th and 75th percentiles of the distributions. In the last column, a direct comparison of the mass growth for galaxies in different environments, independent on the process is also reported. Numbers in parenthesis are the number of galaxies in each environment, in each stellar mass bin.
Current usage metrics show cumulative count of Article Views (full-text article views including HTML views, PDF and ePub downloads, according to the available data) and Abstracts Views on Vision4Press platform.
Data correspond to usage on the plateform after 2015. The current usage metrics is available 48-96 hours after online publication and is updated daily on week days.
Initial download of the metrics may take a while.