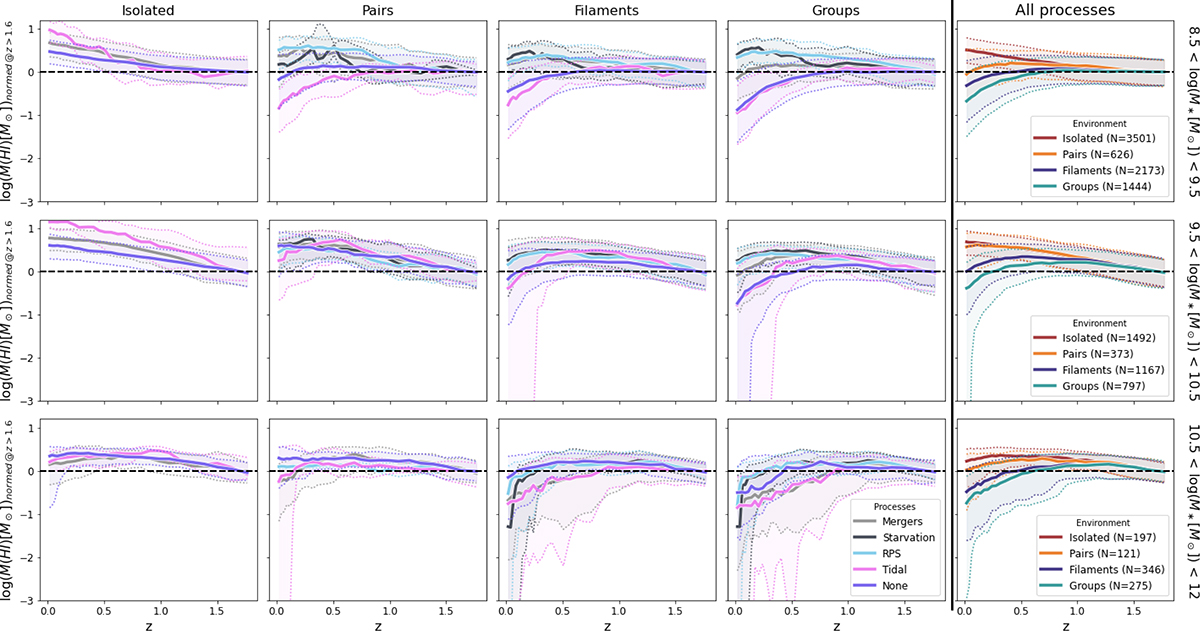
Fig. 18.
Download original image
Evolution of normalized HI mass content as a function of time for galaxies in different environments, undergoing different mechanisms and in three different stellar mass bins. For each mass bin and environment, we compute the mean median HI of the “none” (unperturbed) population at z > 1.6 (a different z range is used for pairs-RPS and pair-tidal, as explained in the text) and shift all curves so that this baseline is zero. Each process curve is additionally aligned to this baseline using its own mean in the same redshift interval. In the left columns, we use the isolated galaxies as baseline. The dashed line at y = 0 shows the case of no evolution. Columns, panels, and symbols are the same as in Fig. 16.
Current usage metrics show cumulative count of Article Views (full-text article views including HTML views, PDF and ePub downloads, according to the available data) and Abstracts Views on Vision4Press platform.
Data correspond to usage on the plateform after 2015. The current usage metrics is available 48-96 hours after online publication and is updated daily on week days.
Initial download of the metrics may take a while.