Fig. 21.
Download original image
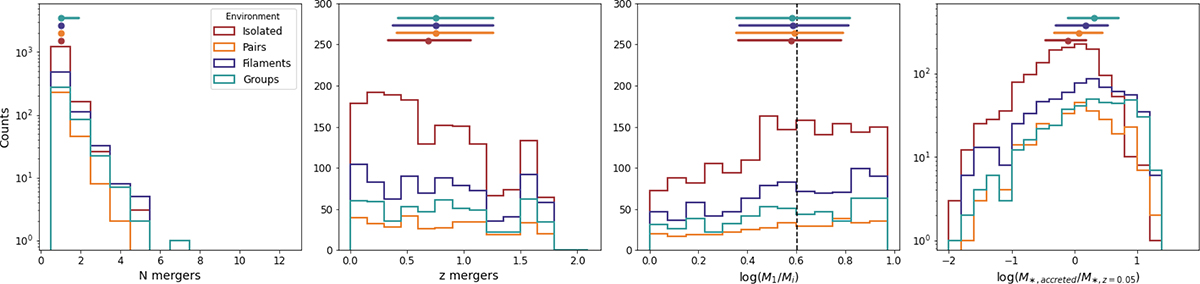
Distributions characterizing the nature of mergers, in the different environments. From left to right: number of merger events, redshift at which mergers happened, mass ratio between the galaxy involved, mass accreted by mergers in galaxies. In each panel, circles and horizontal lines show median values along with the 25th and 75th percentiles of the distributions. In the third panel, vertical dashed lines indicate the threshold commonly adopted to separate minor and major mergers (1:4).
Current usage metrics show cumulative count of Article Views (full-text article views including HTML views, PDF and ePub downloads, according to the available data) and Abstracts Views on Vision4Press platform.
Data correspond to usage on the plateform after 2015. The current usage metrics is available 48-96 hours after online publication and is updated daily on week days.
Initial download of the metrics may take a while.