Open Access
Fig. B.3.
Download original image
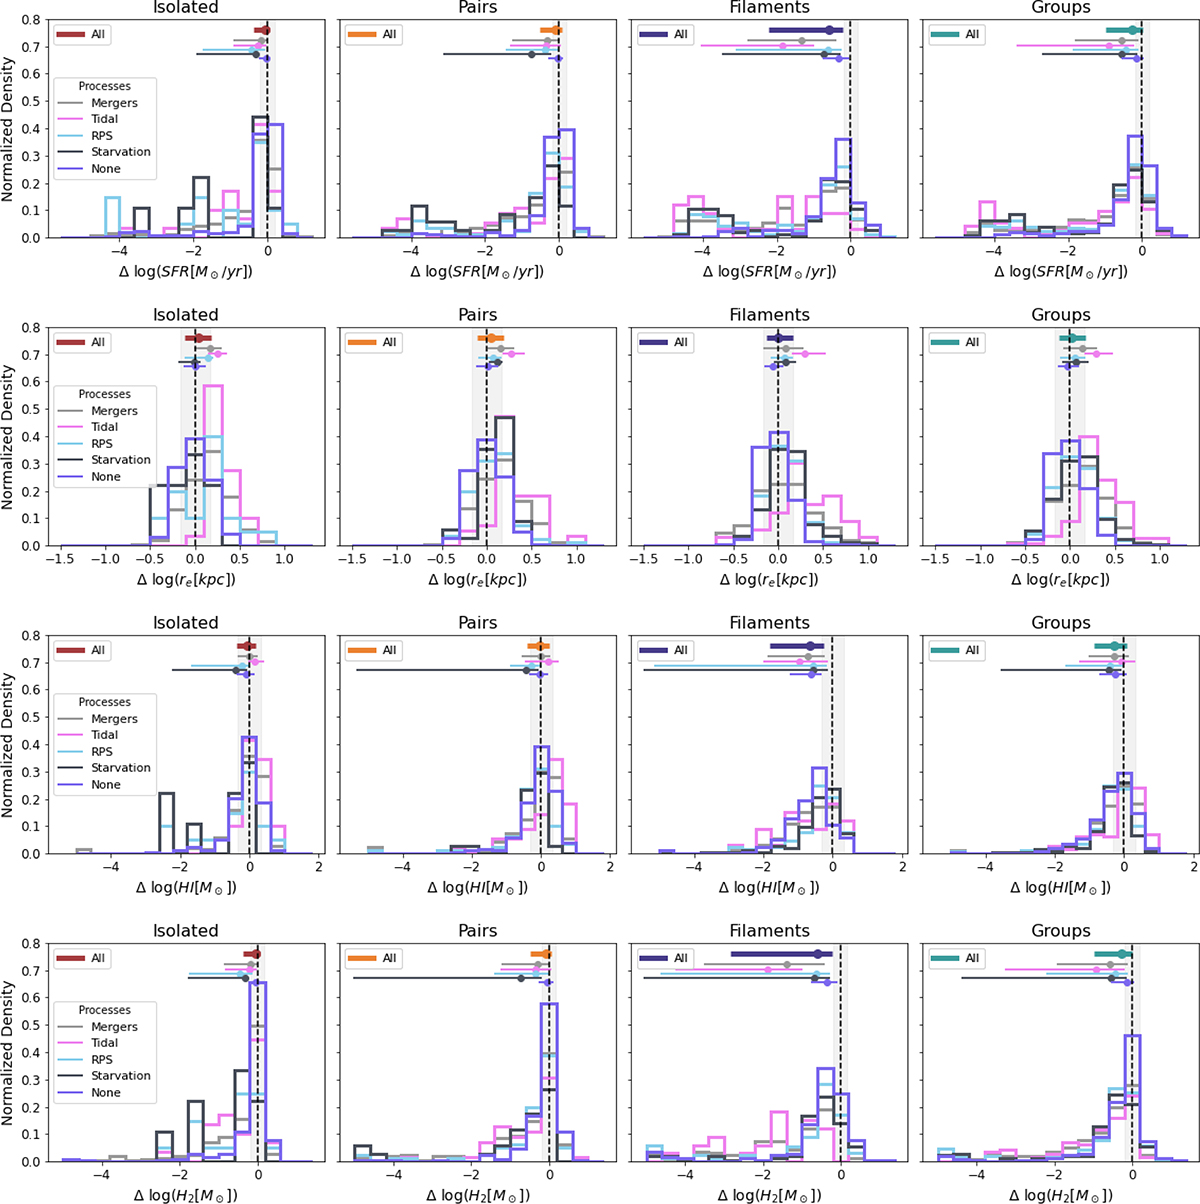
Normalized distribution of the difference between each galaxy SFR (top), size (second from the top), HI (second to bottom) and H2 (bottom) and the expected corresponding value given its mass and the best fit. The 2D environment definition is adopted. Panels, colors, lines, and symbols are as the same in Fig. 11.
Current usage metrics show cumulative count of Article Views (full-text article views including HTML views, PDF and ePub downloads, according to the available data) and Abstracts Views on Vision4Press platform.
Data correspond to usage on the plateform after 2015. The current usage metrics is available 48-96 hours after online publication and is updated daily on week days.
Initial download of the metrics may take a while.