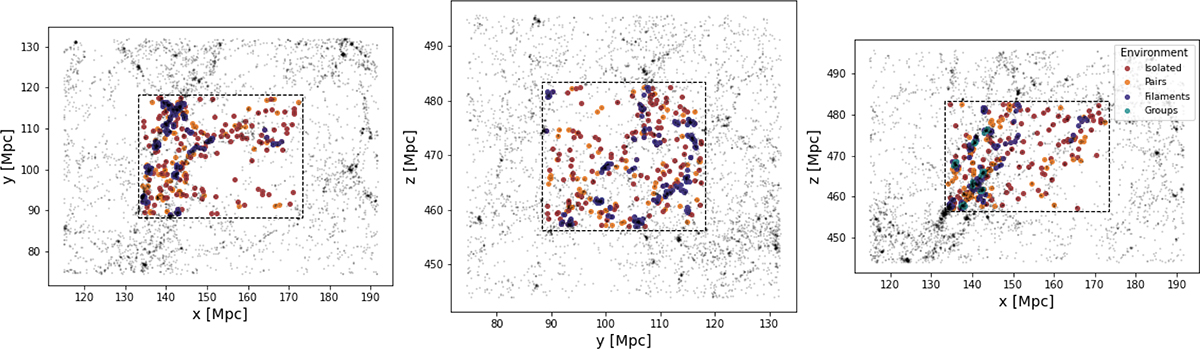
Fig. 3.
Download original image
Example of one of the extracted sub volumes (within the dashed rectangle) and the surrounding region. Each panel shows a different projection. Within the sub-box, galaxies belonging to different environments are highlighted: isolated (rusty red), pairs (orange), filaments (steel blue), groups (forest green). This is based on the 2D environmental definition, i.e., mimicking the observational approach, but no significant changes are seen when adopted the other definitions.
Current usage metrics show cumulative count of Article Views (full-text article views including HTML views, PDF and ePub downloads, according to the available data) and Abstracts Views on Vision4Press platform.
Data correspond to usage on the plateform after 2015. The current usage metrics is available 48-96 hours after online publication and is updated daily on week days.
Initial download of the metrics may take a while.