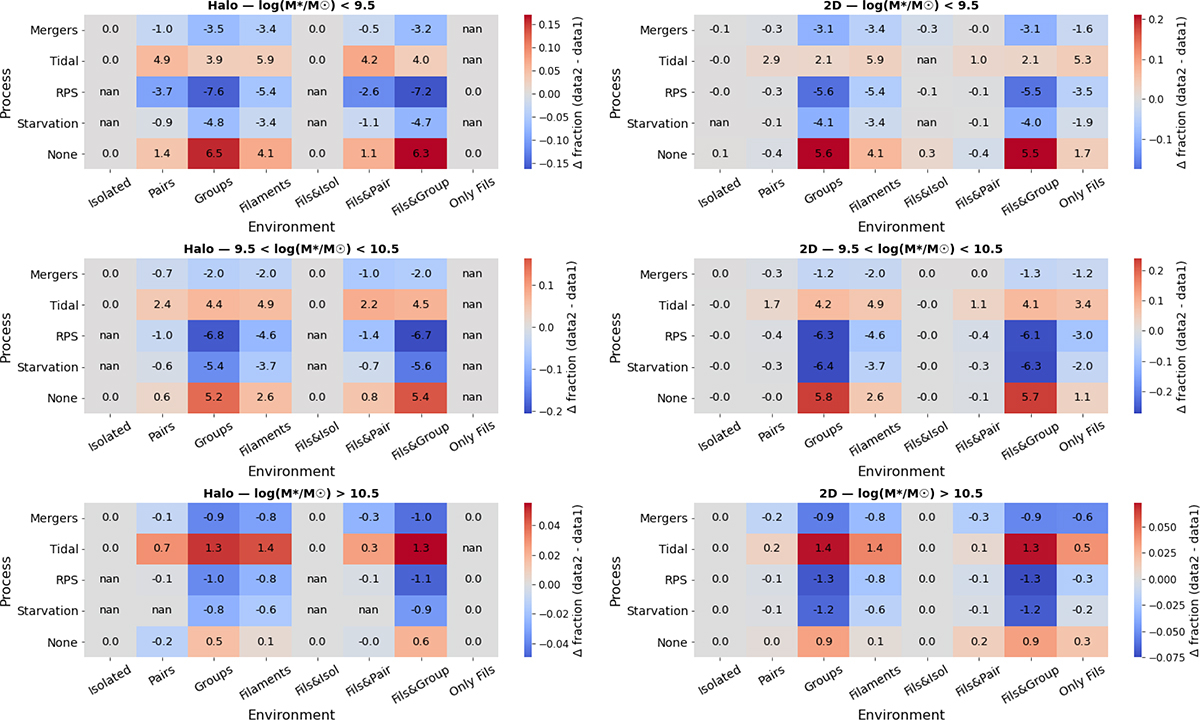
Fig. C.1.
Download original image
Heatmap representation of the fractional differences Δf = fdata2 − fdata1 between the two datasets, for each stellar mass bin and classification scheme. Each panel shows the comparison as a function of environment (x-axis) and physical process (y-axis). Red cells denote higher fractions in data2 relative to data1, while blue cells indicate lower fractions. The color intensity reflects the amplitude of the difference, with neutral tones corresponding to consistent results within uncertainties.
Current usage metrics show cumulative count of Article Views (full-text article views including HTML views, PDF and ePub downloads, according to the available data) and Abstracts Views on Vision4Press platform.
Data correspond to usage on the plateform after 2015. The current usage metrics is available 48-96 hours after online publication and is updated daily on week days.
Initial download of the metrics may take a while.