Fig. 4.
Download original image
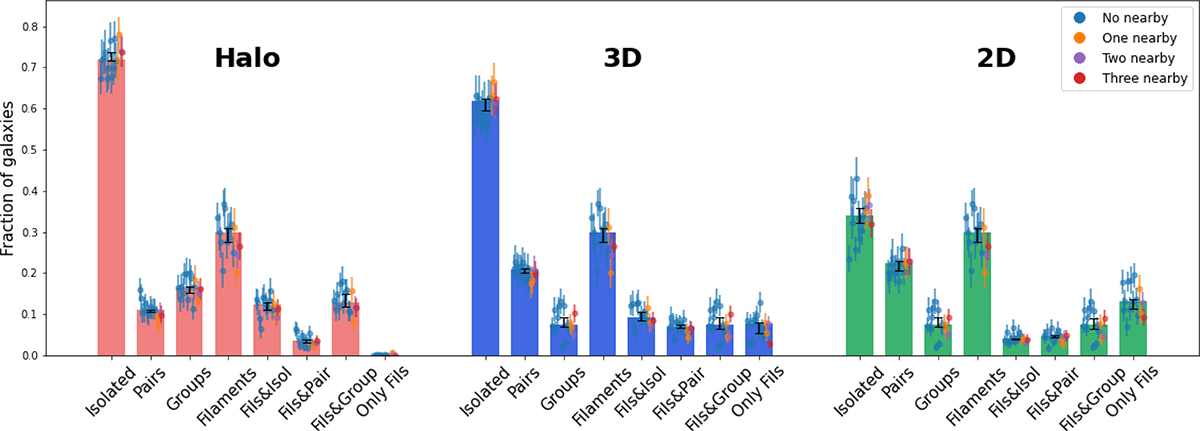
Frequency of galaxies in the different environments, based on the three adopted definitions of environment. Reported fractions are the median value of the 15 realizations, with the black errorbars showing the binomial errors. Small circles represent the results from the individual extracted sub-boxes and colors refer to sub-boxes with different numbers of neighboring groups, as defined in the labels.
Current usage metrics show cumulative count of Article Views (full-text article views including HTML views, PDF and ePub downloads, according to the available data) and Abstracts Views on Vision4Press platform.
Data correspond to usage on the plateform after 2015. The current usage metrics is available 48-96 hours after online publication and is updated daily on week days.
Initial download of the metrics may take a while.