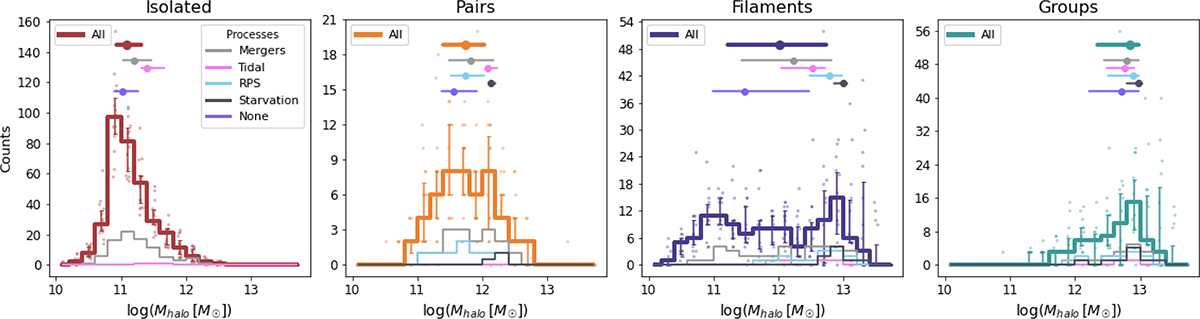
Fig. 7.
Download original image
Halo mass distribution for galaxies in different environments (based on the halo definition) and affected by different mechanisms. Small circles show the distributions for the individual realizations. When the physical processes are taken into account, neither single realizations nor errobars are shown, for the sake of clarity. The distribution of galaxies not undergoing physical mechanisms is not reported, but can be inferred by the difference between the total and the sum of the other mechanisms. Circles and horizontal lines show median values along with the 25 and 75 percentiles of the distributions. Median values for the “none” categories are also given. Thicker lines with errorbars shows the median distribution in each environment, regardless of the mechanisms.
Current usage metrics show cumulative count of Article Views (full-text article views including HTML views, PDF and ePub downloads, according to the available data) and Abstracts Views on Vision4Press platform.
Data correspond to usage on the plateform after 2015. The current usage metrics is available 48-96 hours after online publication and is updated daily on week days.
Initial download of the metrics may take a while.