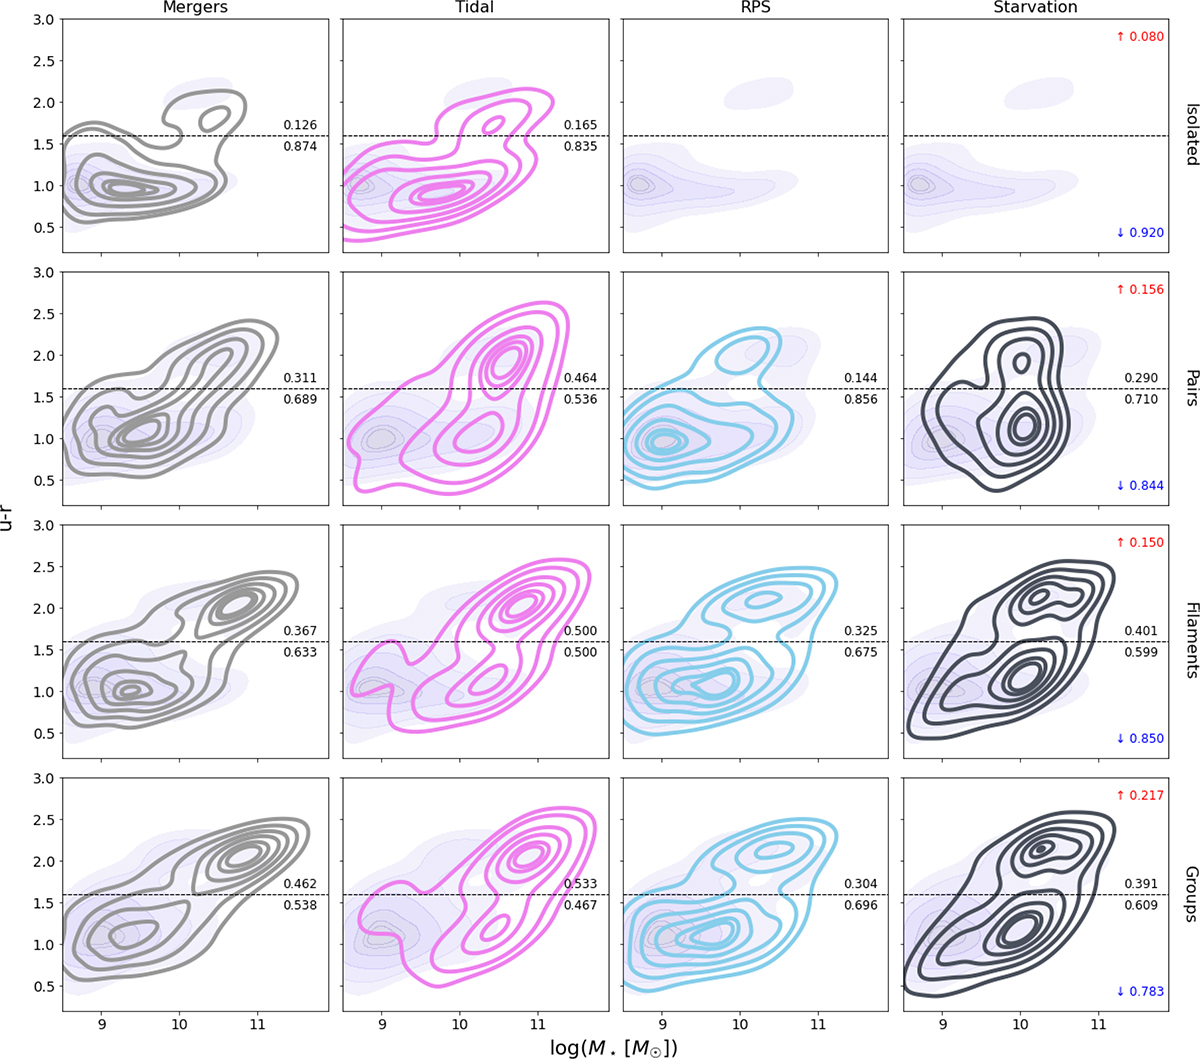
Fig. 9.
Download original image
u − r vs. stellar mass diagram for galaxies experiencing different physical mechanisms (columns) and residing in different halo-defined environments (rows). Solid lines represent the 10th, 25th, 50th (median), 75th, 90th, and 95th percentiles of the distributions. In each panel, the curves correspond to the mechanism indicated at the top and the environment indicated on the left. As a reference, the background shaded distribution shows galaxies in the same environment not affected by any mechanism. These red curves are identical across all columns within a given row. A horizontal line at u − r = 1.6 is shown as a tentative division between blue and red galaxies. The numbers above and below this line indicate the fraction of galaxies in the red and blue regions, respectively. In the rightmost column, the red and blue fractions refer to the population of galaxies not undergoing any process.
Current usage metrics show cumulative count of Article Views (full-text article views including HTML views, PDF and ePub downloads, according to the available data) and Abstracts Views on Vision4Press platform.
Data correspond to usage on the plateform after 2015. The current usage metrics is available 48-96 hours after online publication and is updated daily on week days.
Initial download of the metrics may take a while.