Open Access
Fig. 1.
Download original image
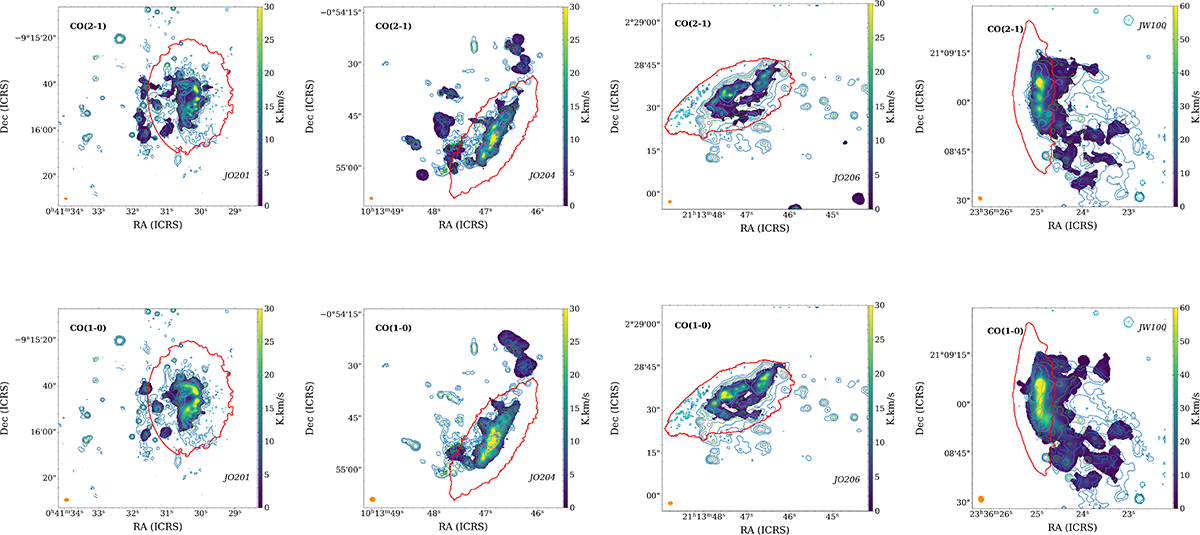
CO(2−1) and CO(1−0) zero-moment maps for JO201, JO204, JO206, and JW100. The red contour shows the extent of the stellar disk, as defined in Gullieuszik et al. (2020). The beam size is the orange ellipse in the lower left corner of each map. Colored contours delineate the Hα emission derived from MUSE data.
Current usage metrics show cumulative count of Article Views (full-text article views including HTML views, PDF and ePub downloads, according to the available data) and Abstracts Views on Vision4Press platform.
Data correspond to usage on the plateform after 2015. The current usage metrics is available 48-96 hours after online publication and is updated daily on week days.
Initial download of the metrics may take a while.