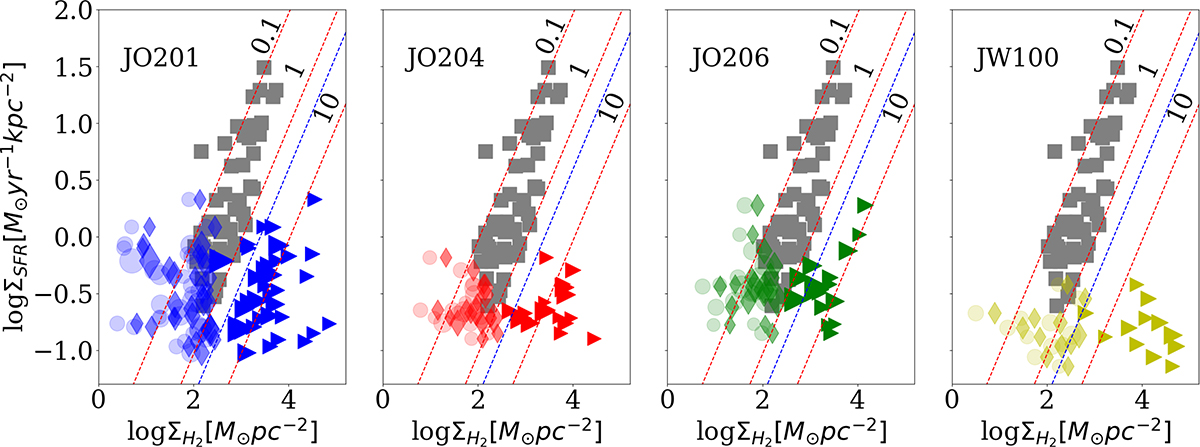
Fig. 10.
Download original image
Star formation rate density of HST star-forming and resolved (disk and tail) clumps (Giunchi et al. 2023) as a function of the CO(2−1) surface mass density derived from the ALMA data and converted to small scales assuming that the CO is distributed: (a) over the entire MUSE clump (transparent circles), (b) as in local galaxies using the 1 kpc–150 pc scaling relation (filled diamonds; Sun et al. 2022), and (c) over the HST clump (filled triangles), as detailed in the text. The four panels from left to right refer to the JO201 (blue), JO204 (red), JO206 (green), and JW100 (yellow) clumps. The size of symbols is proportional to the HST clump size. Gray squares refer to the disks of starburst galaxies (Kennicutt & De Los Reyes 2021). Dashed red lines show constant depletion times from 0.1 to 10 gigayears, while the blue one refers to the relation at 1 kpc scale (Bigiel et al. 2011).
Current usage metrics show cumulative count of Article Views (full-text article views including HTML views, PDF and ePub downloads, according to the available data) and Abstracts Views on Vision4Press platform.
Data correspond to usage on the plateform after 2015. The current usage metrics is available 48-96 hours after online publication and is updated daily on week days.
Initial download of the metrics may take a while.