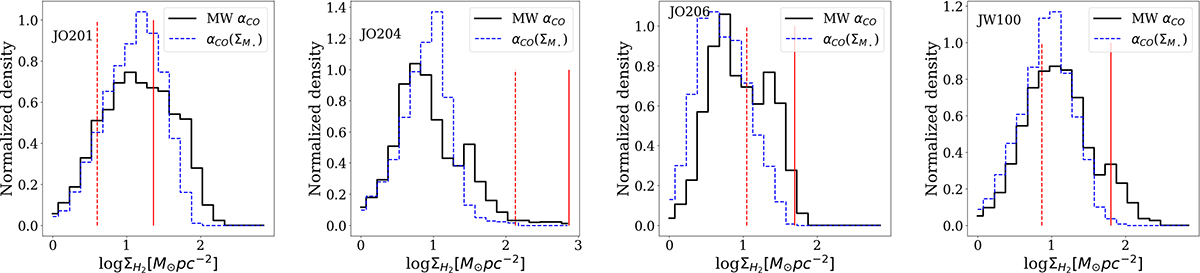
Fig. 2.
Download original image
Distribution of the CO(2−1) derived molecular gas mass surface densities using the MW αCO (continuous black histogram) and a varying αCO that follows the stellar mass density distribution (dashed blue histogram), using the relation given in Sandstrom et al. (2013). The vertical dashed and continuous red lines show the average density at the galaxy centers, estimated over the central ≃1 kpc2, assuming the variable αCO and the MW αCO, respectively.
Current usage metrics show cumulative count of Article Views (full-text article views including HTML views, PDF and ePub downloads, according to the available data) and Abstracts Views on Vision4Press platform.
Data correspond to usage on the plateform after 2015. The current usage metrics is available 48-96 hours after online publication and is updated daily on week days.
Initial download of the metrics may take a while.