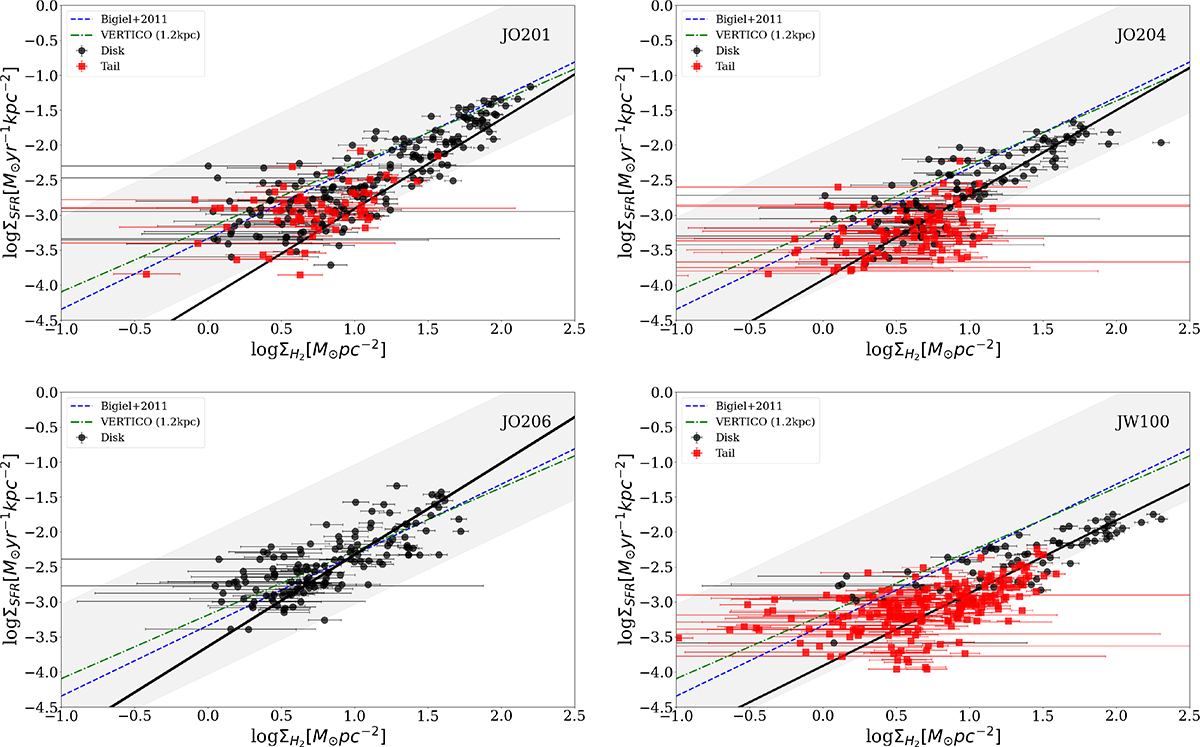
Fig. 3.
Download original image
Star formation rate density as a function of the H2 surface mass density from the CO(2−1) measured on 1 kpc scale for the GASP galaxies JO201, JO204, JO206, and JW100 (from top left to bottom right). The shaded region encompasses the zone with depletion times between 0.1 and 10 Gyr. The continuous black line is the fit to the disk regions (in black) that takes into account errors on both coordinates, the dashed blue line is the local relation on 1 kpc scale from Bigiel et al. (2011), and the dashed green line was derived for VERTICO galaxies on a 1.2 kpc scale from Jiménez-Donaire et al. (2023). The red squares show the measurements corresponding to the tails.
Current usage metrics show cumulative count of Article Views (full-text article views including HTML views, PDF and ePub downloads, according to the available data) and Abstracts Views on Vision4Press platform.
Data correspond to usage on the plateform after 2015. The current usage metrics is available 48-96 hours after online publication and is updated daily on week days.
Initial download of the metrics may take a while.