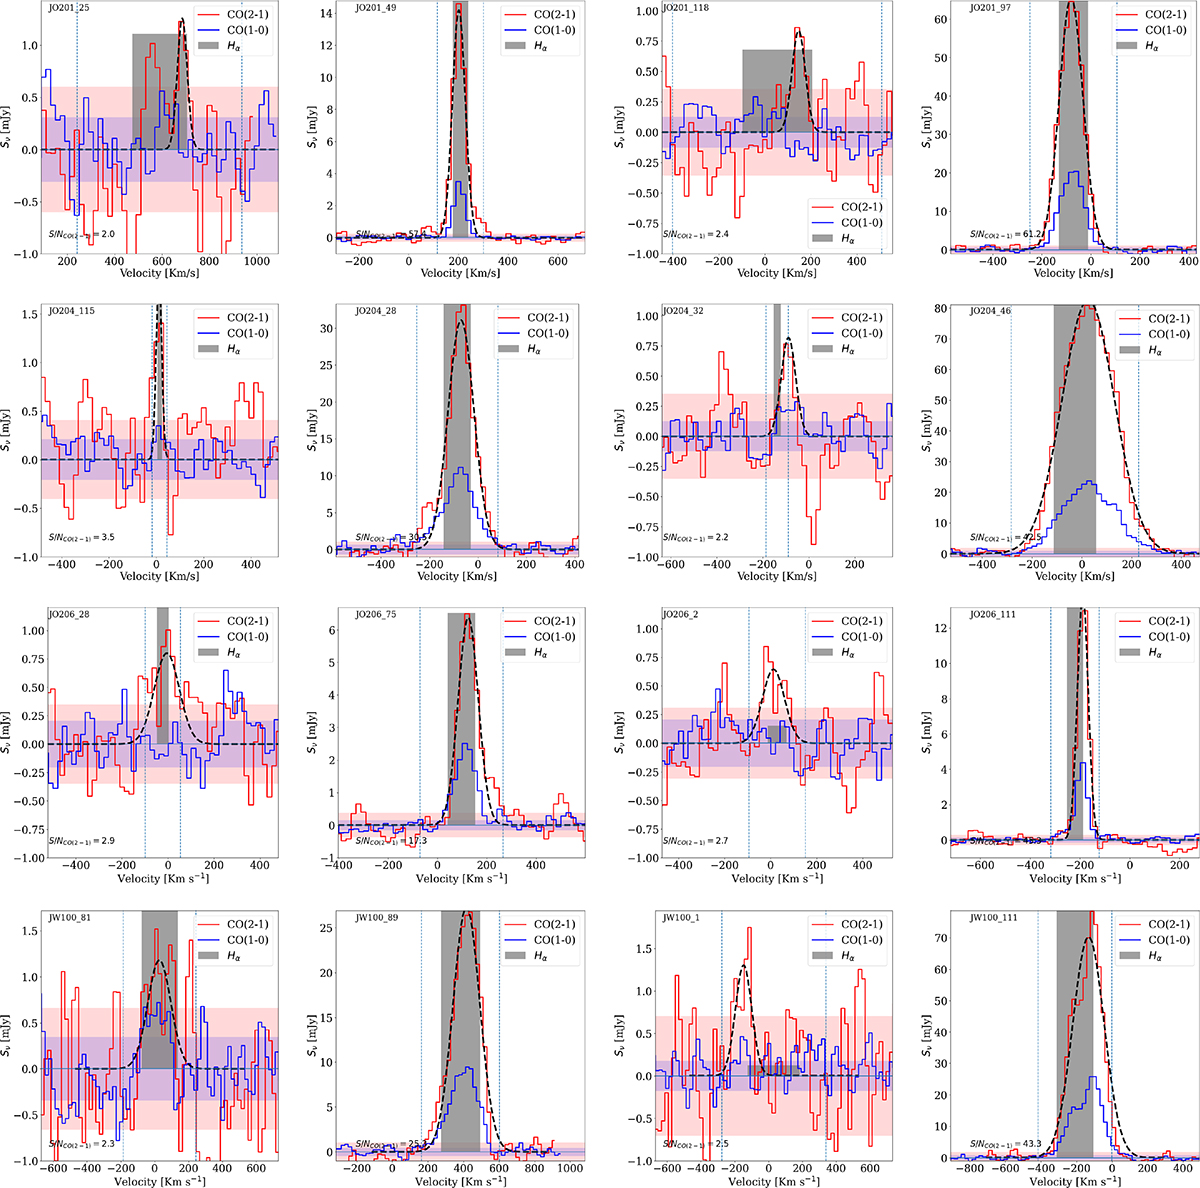
Fig. 6.
Download original image
Gallery of spectra extracted from the ALMA cubes within the star-forming regions identified by the Hα emission from MUSE. The top row refers to JO201 clumps, the second row to JO204, the third row to JO206, and the fourth row to JW100. Red lines show the CO(2−1) line emission, and the dashed black line its Gaussian fit, while blue lines show the CO(1−0) line emission. The gray box indicates the location of the Hα emission and has a width corresponding to twice the Hα velocity dispersion within the clump. Its height is proportional to the Hα flux. The shaded horizontal regions mark the rms of the CO(2−1) and CO(1−0) emission, in red and blue, respectively. These spectra are representative of the lowest (first and third columns) and highest (second and fourth columns) S/N spectra in the analyzed sample and have been flagged differently according to the preferred method to evaluate the total gas emission: the first two columns show spectra flagged as 0 (flux derived from the integral of the positive emission), while columns 3 and 4 are flagged as 3 (flux derived from a Gaussian fit).
Current usage metrics show cumulative count of Article Views (full-text article views including HTML views, PDF and ePub downloads, according to the available data) and Abstracts Views on Vision4Press platform.
Data correspond to usage on the plateform after 2015. The current usage metrics is available 48-96 hours after online publication and is updated daily on week days.
Initial download of the metrics may take a while.