Fig. 7.
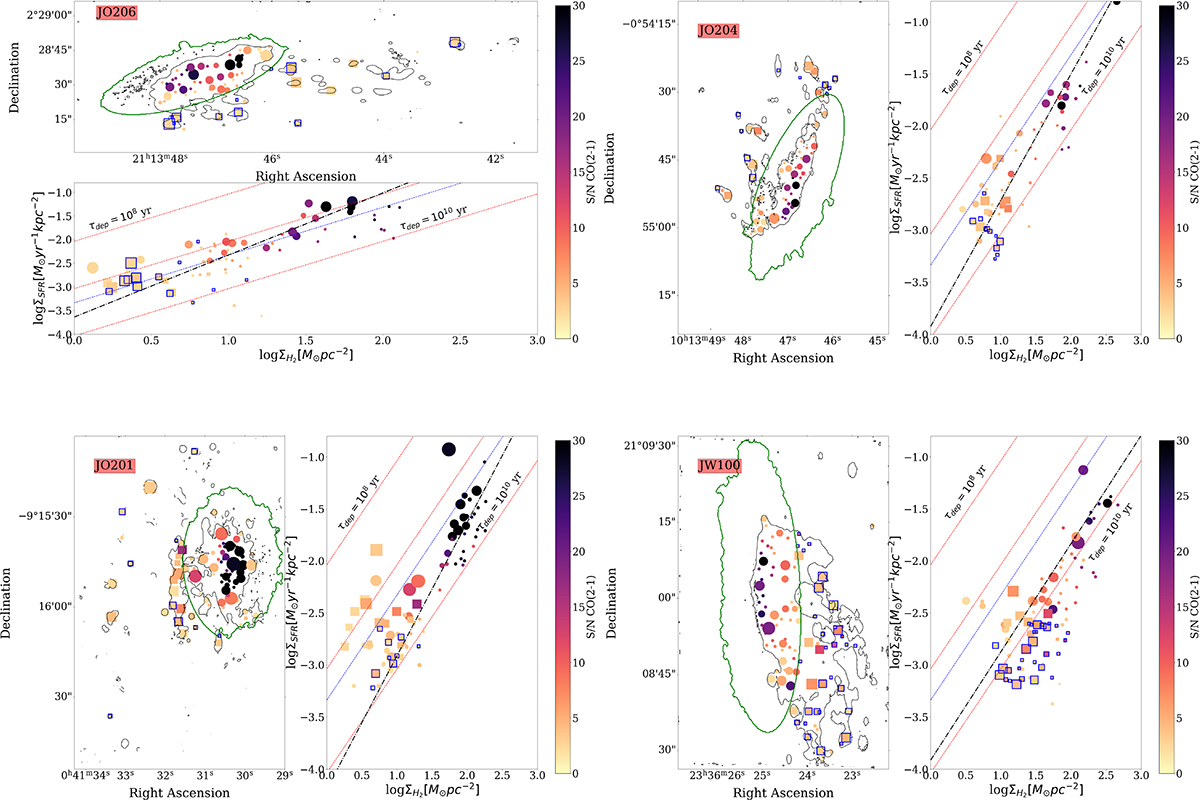
Download original image
Maps of the Hα emitting knots and corresponding KS relation in JO206, JO204, JO201, and JW100 from top to bottom, with different symbols for knots in the disk (circles) and in the tail (squares). Blue contours indicate knots dominated by the DIG. The size of each symbol is proportional to the size of the emitting region, and it is color-coded according to the S/N in the CO(2−1) line. The dashed red lines show lines of a constant depletion time (from 108 to 1010 yr), while the dashed blue shows the relation at a 1 kpc scale from Bigiel et al. (2011). The dash-dotted black lines show the relation found analyzing independent beams, the slopes and intercepts of which are given in Table 3.
Current usage metrics show cumulative count of Article Views (full-text article views including HTML views, PDF and ePub downloads, according to the available data) and Abstracts Views on Vision4Press platform.
Data correspond to usage on the plateform after 2015. The current usage metrics is available 48-96 hours after online publication and is updated daily on week days.
Initial download of the metrics may take a while.